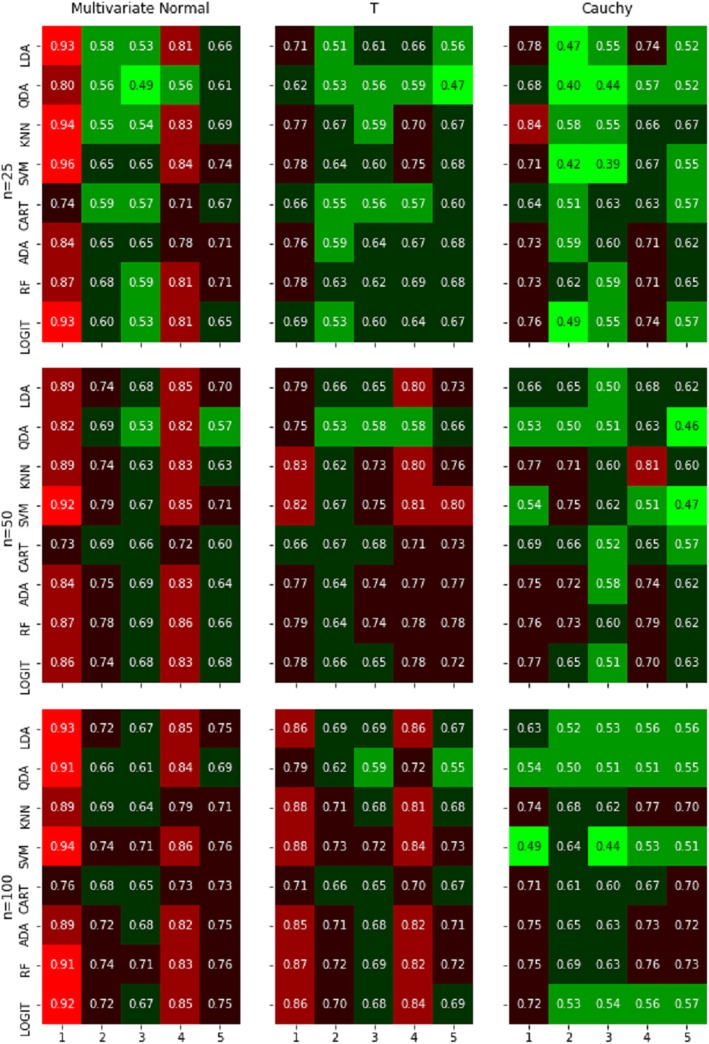
Fig. 1.
Heat map of average classification rates obtained using 5-fold CV and 1000 Monte Carlo runs. Rows represent the eight classifiers: Linear Discriminant Analysis (LDA), Quadratic Discriminant Analysis (QDA), K-Nearest Neighbor (KNN), Support Vector Machine (SVM), Classification Tree (CART), AdaBoost (ADA), Random Forest (RF), and Logistic Regression (LOGIT). Columns represent correlation matrices: compound symmetry with zero off-diagonal correlation (ρ = 0); compound symmetry with 0.4 off-diagonal correlation (ρ = 0.4); compound symmetry with 0.8 off-diagonal correlation (ρ = 0.8); AR(1) with ρ = 0.4; AR(1) with ρ = 0.8. Classification rate is color-coded: red, black, and green representing high, medium, and low rates, respectively

