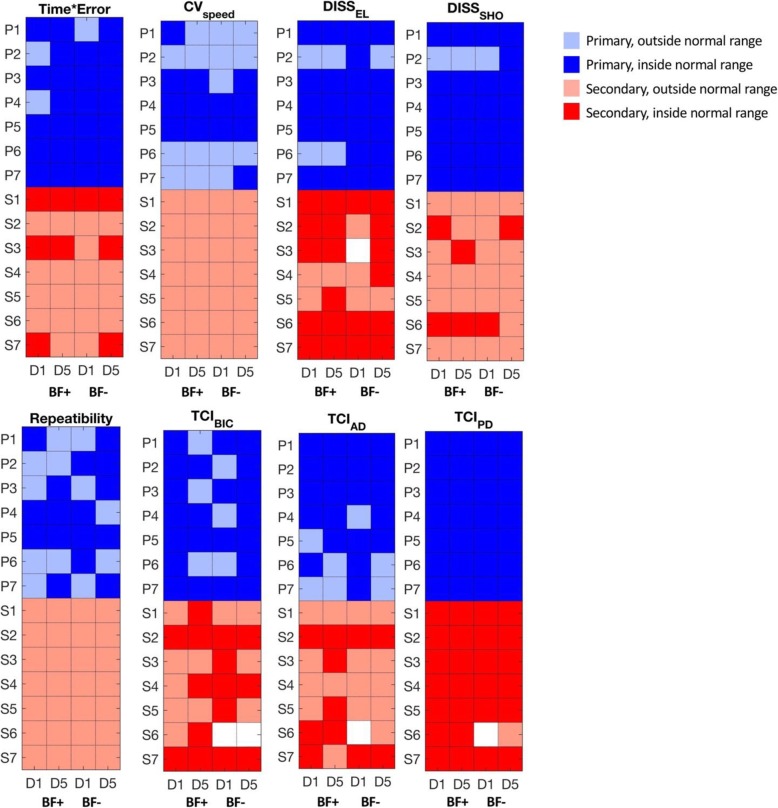
Fig. 5.
Comparison between dystonia patients and healthy subjects. For each outcome measure, a normality range was identified as the 95% confidential internal achieved by the group of healthy subjects. Mean values obtained by patients in each single session were compared to the normality range and used to represent a map: darker color indicates values within the normality range, lighter color indicates values outside the normality range. White cells indicate data not available due to acquisition failures and/or technical issues

