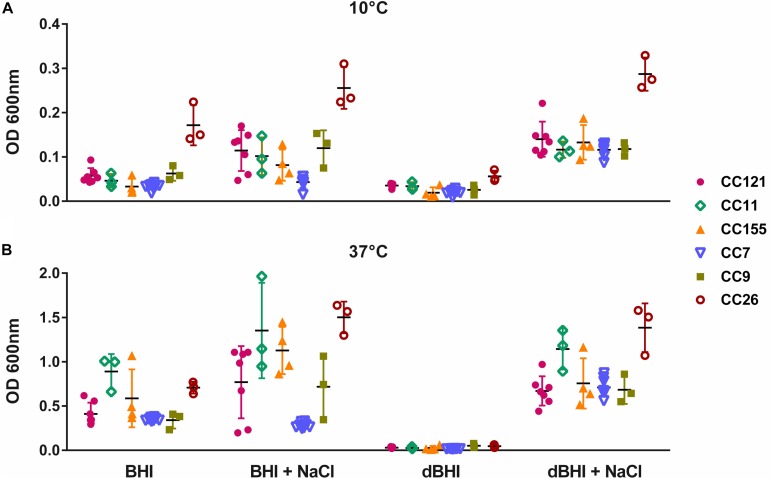
FIGURE 4.
Inter- and intra-genotype variation in biofilm formation. MPA results are shown at (A) 10°C and (B) 37°C. Isolates belonging to six genotypes, each represented by at least three isolates are plotted; CC121 (n = 7), CC11 (n = 3), CC155 (n = 4), CC7 (n = 8), CC9 (n = 3), and CC26 (n = 3). Each symbol represents one isolate; vertical lines indicate SD and horizontal bars the mean values. Data were analyzed using One-way ANOVA and Turkey’s multiple comparison tests, p < 0.05. CC26 formed statistically more biofilms than other genotypes in all conditions at 10°C and in dBHI + NaCl at 37°C.

