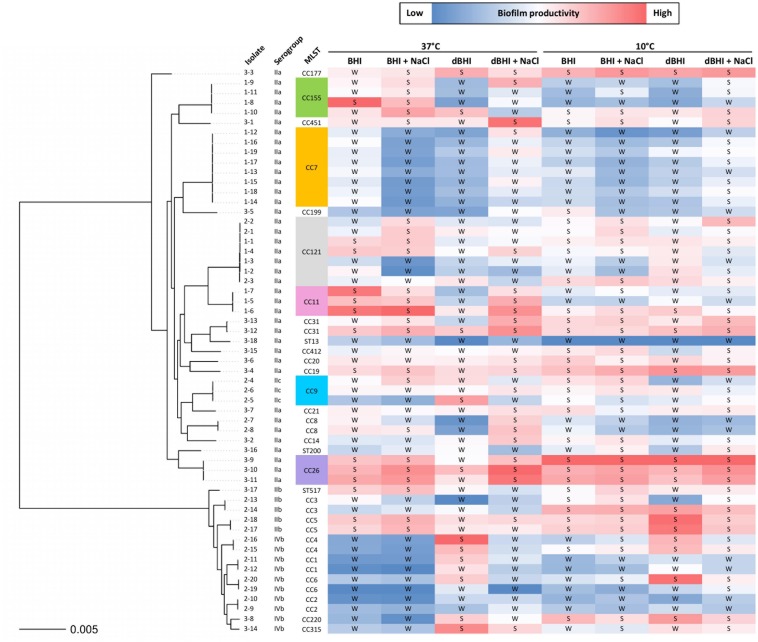
FIGURE 6.
Phylogenetic tree of 57 L. monocytogenes isolates with relative biofilm productivity. A color scale is applied to MPA results within each growth condition to reflect biofilm productivity. The isolate names are shown as group number (1, persistent; 2, prevalent; 3, rare) hyphened with isolate numbers. Binary transformation of the isolates based on MPA results is indicated as S, strong and W, weak biofilm former.

