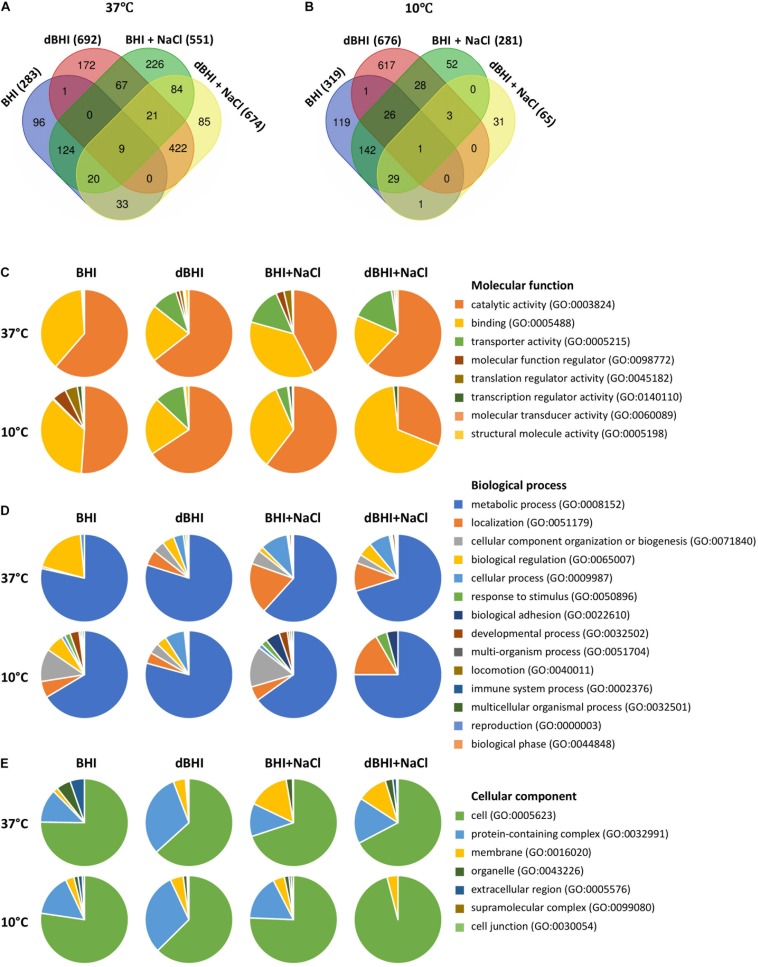
FIGURE 7.
Genes identified by pan-genome-wide association study (pan-GWAS) and gene ontology (GO) analysis under different growth conditions. Venn diagrams show number of genes related to each condition at (A) 37°C and (B) 10°C. PANTHER derived GO-slim categories for (C) molecular function, (D) biological process, and (E) cellular component are presented in pie charts.

