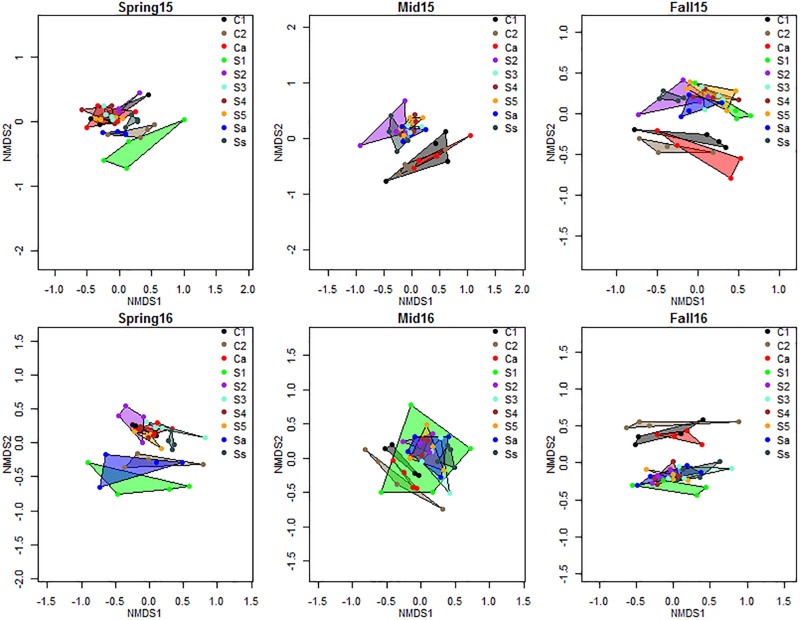
FIGURE 3.
NMDS plot of Bray–Curtis distance matrix of bacterial communities by crop sequences. Crop sequence treatments include first (C1) and second (C2) year of corn following 5-year soybean rotation, annual rotation of corn (Ca) following annual rotation of soybean (Sa), years 1–5 (S1–S5) of soybean following a 5-year corn rotation, and susceptible soybean (Ss) monoculture. Color coded shapes connect the four replicate datapoints representing communities from four replicate plots of each crop sequence.

