
Figure 1.
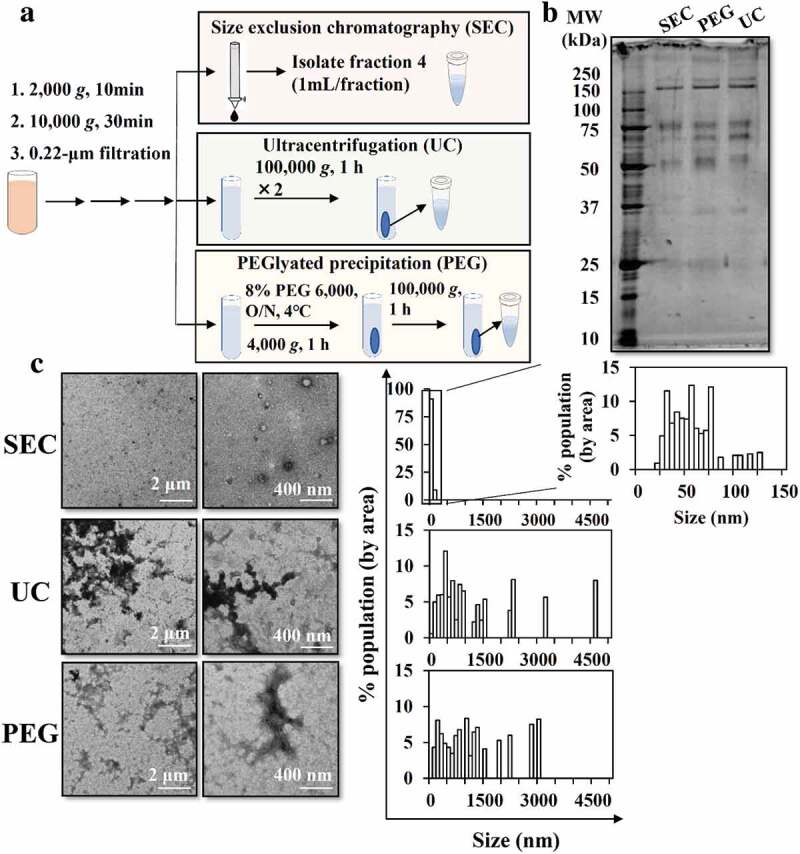
Comparison of methods to isolate sEVs from mouse plasma. (a) Scheme for sEV isolation from mouse plasma through SEC, UC, and PEG-based isolation. (b) Protein profiles were examined by SDS-PAGE (0.1 µg protein/lane). (c) Morphology was examined by TEM. TEM images in low (left) and high (right) magnification are shown. Representative TEM images were analysed by Image J software to measure the size histogram.