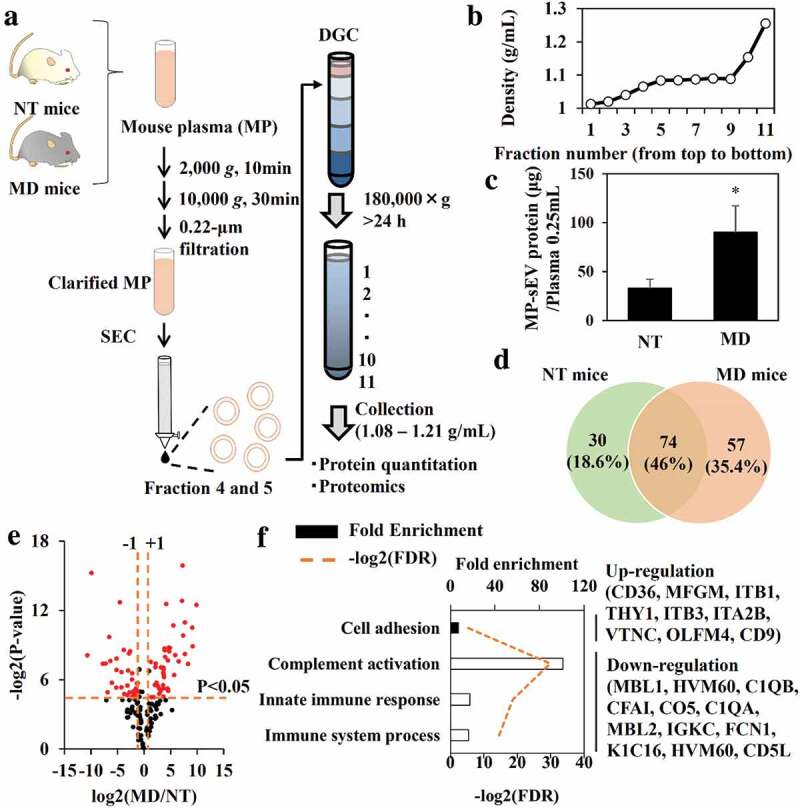
Figure 5.

Quantitative and qualitative differences in MP-sEVs between NT mice and MD mice. (a) Scheme for the isolation of highly purified MP-sEVs from NT or MD mice. (b) Typical density profile of each fraction from top to bottom after density gradient centrifugation. (c) Quantification of sEV amounts isolated from NT and MD mice, as estimated by protein quantification. Results are expressed as the mean ± SD (n = 3). *p < 0.05 versus NT mice. (d–f) Proteomic analysis of MP-sEVs from NT and MD mice (n = 3). (d) Venn diagram of proteins detected in the two samples. (e) Identified proteins were ranked in a volcano plot according to their statistical P-value (y-axis) and their relative abundance ratios (log2 fold-change, x-axis) between MP-sEVs from NT and MD mice. Red dots indicate the proteins with both P value < 0.05 and log2 fold-change < −1 or > 1). (f) Gene ontology enrichment analysis for up-regulated (closed bar) and down-regulated proteins (open bar) after macrophage depletion. FDR values < 0.05 are listed. The related genes are listed to the right.
