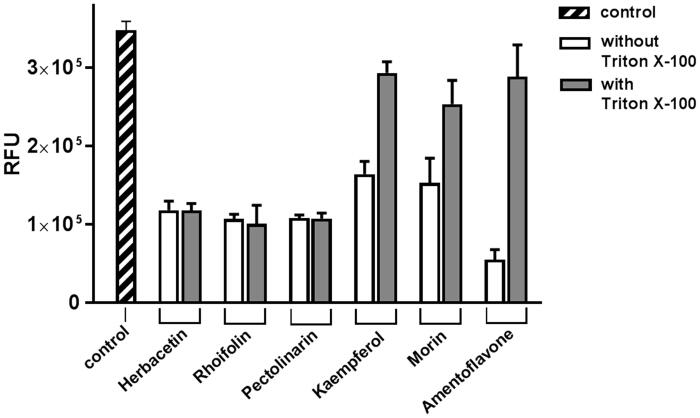
Figure 5.
The effect of Triton X-100 on flavonoids. Each of two bars represents the inhibitory activity of compounds w/wt 0.01% Triton X-100. The first bar (shaded) represents the control. Inhibitory compounds were used at 40 μM concentration. Each bar is expressed as the mean ± standard error of the mean (n = 3). RFU: Relative Fluorescence Units.

