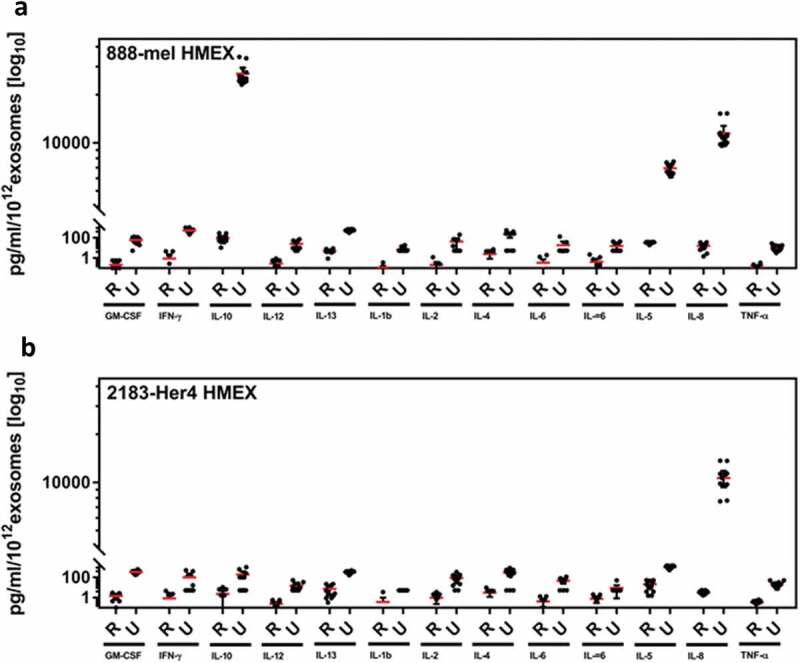
Figure 6.

Ratio of soluble cytokine concentration to the number of exosomes isolated. When controlled for number of exosomes, cytokine profile per 1012 exosomes were up to 836 fold lower in REIUS compared to UC. A decrease was observed in both (a) 888-mel HMEX and (b) 2183-Her4 HMEX (n = at least 6).
