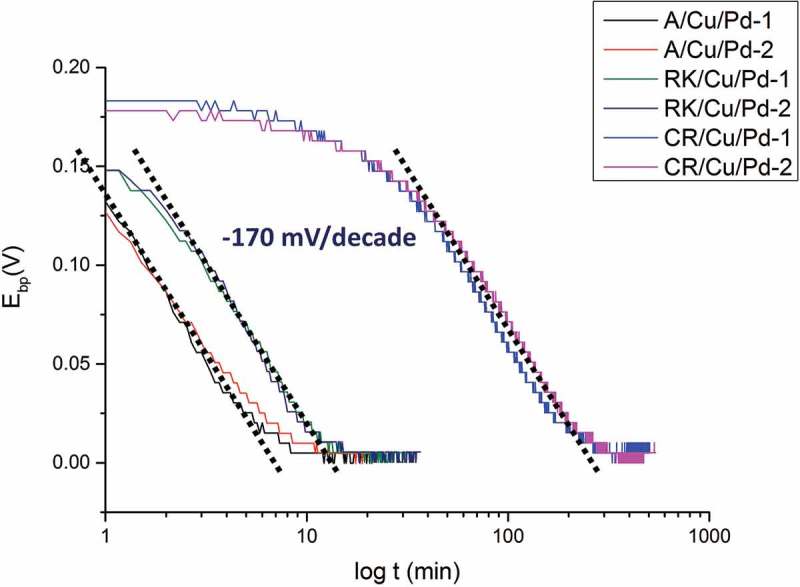
Figure 6.

Plot of E vs. log t with time lag subtracted from raw permeation data. All steel samples (A, RK, CR/Cu/Pd; 1&2 are labelled for sample 1 and sample 2) are charged with hydrogen for entry steel side under same conditions with same specimen thickness (1.35 mm). All samples with same thickness (1.35 mm) are loaded with hydrogen under same conditions at the entry cell (0.1 M H2SO4 + 0.2 mM thiourea, galvanostat: −1.2 mA/cm2).
