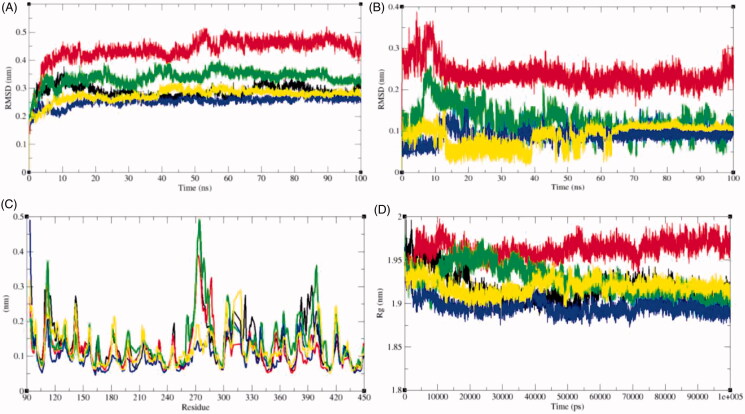
Figure 6.
Dynamics of ligands binding to the SphK1. (A) RMSD plot as a function of time. Black, red, green, blue, and yellow colours represent values obtained for SphK1, SphK1–STD, SphK1–ZINC06823429, SphK1–ZINC95421070, and SphK1–ZINC95421501, respectively. (B) Comparison of orientations of PF-543 (red), ZINC06823429 (green), ZINC95421070 (blue), and ZINC95421501 (yellow) into the active pocket of SphK1. (C) Backbone atomic fluctuations (RMSF) plot for SphK1, SphK1–PF-543, SphK1–ZINC06823429, SphK1–ZINC95421070, and SphK1–ZINC95421501. (D) Time evolution of radius of gyration (Rg) values during 100,000 ps (100 ns) of MD simulation. The Rg plot for SphK1 is shown in black. Red, green, blue, and yellow colours represent Rg plot for SphK1–PF-543, SphK1–ZINC06823429, SphK1–ZINC95421070, and SphK1–ZINC95421501, respectively.

