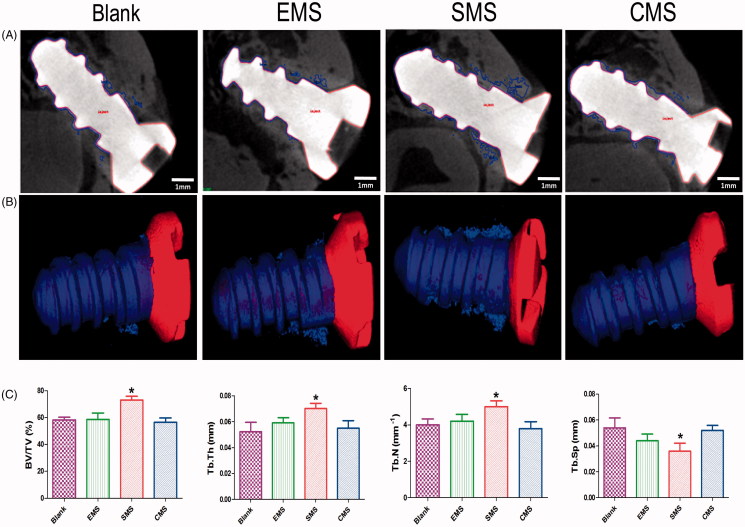
Figure 8.
Peri-implant bone formation observed by micro-CT (A) At Week 4 after surgery, the peri-implant bone formation was observed. (B) 3 D reconstructed views of the newly formed bone (blue) and titanium implant (Red). (C) Quantitative data were obtained by micro-CT analysis including BV/TV, TB.Th, TB.N, and TB.Sp (n = 5, mean ± SD). *Compared to the Blank group. Differences are significant at p < .05.

