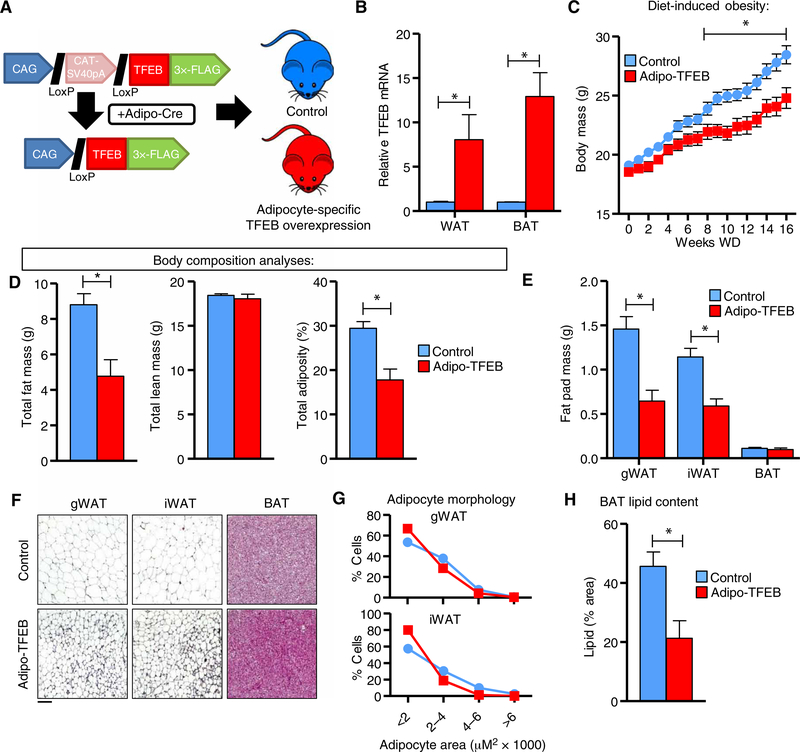
Fig. 1. Adipocyte-specific TFEB overexpression attenuates diet-induced obesity.
(A) Experimental strategy outlining adiponectin-Cre–driven TFEB transgene expression to generate Adipo-TFEB mice. (B) mRNA levels of TFEB in WAT and BAT in 8-week-old, chow-fed female mice (n = 4 control and 5 Adipo-TFEB mice). (C to H) Various metabolic parameters were measured in female mice fed a Western diet for 16 weeks. (C) Body mass response to diet-induced obesity (n = 22 control and 13 Adipo-TFEB mice). (D) Total fat mass, lean mass, and adiposity (n = 16 control, 9 Adipo-TFEB mice). (E) Fat pad masses upon sacrifice (n = 16 control and 9 Adipo-TFEB mice). (F) Representative H&E staining of gWAT, iWAT, and BAT. Scale bar, 100 μm. (G) gWAT and iWAT adipocyte size distributions (pooled from n = 6 control and 4 Adipo-TFEB mice). (H) BAT lipid content (n = 11 control and 7 Adipo-TFEB mice). All data are presented as means ± SEM. Student’s two-tailed t test, *P < 0.05.

