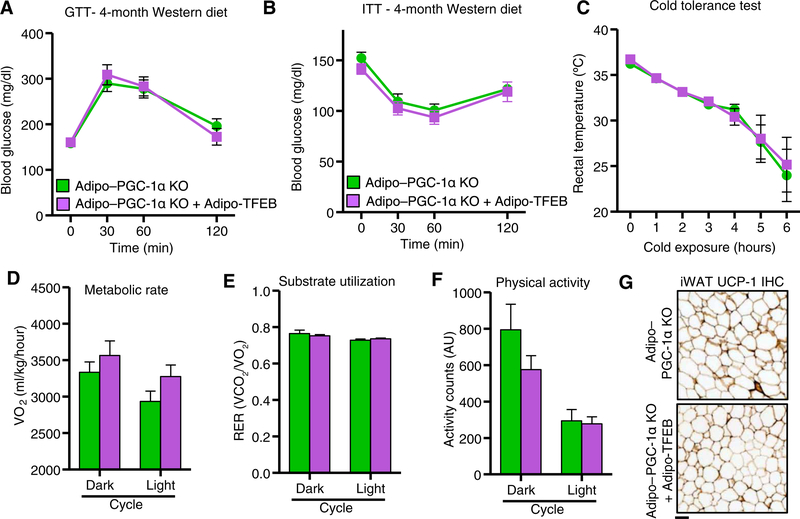
Fig. 8. Physiological metabolic effects of TFEB overexpression are PGC-1α dependent.
(A) Glucose tolerance test (GTT) (n = 10 Adipo–PGC-1α KO and 9 Adipo–PGC-1α KO + Adipo-TFEB male mice fed a Western diet for 4 months). (B) Insulin tolerance test (n = 10 Adipo–PGC-1α KO and 8 Adipo–PGC-1α KO + Adipo-TFEB male mice fed a Western diet for 4 months). (C) Core (rectal) temperatures assessed hourly during a cold tolerance test at 4°C (n = 7 Adipo–PGC-1α KO and 5 Adipo–PGC-1α KO + Adipo-TFEB 6-month-old male mice fed a chow diet). (D) Metabolic cage analyses averaged over dark (active) and light (inactive) cycle (n = 8 Adipo–PGC-1α KO and 8 Adipo-PGC-1α KO + Adipo-TFEB female mice fed a Western diet for 4 months): oxygen consumption. (E) Respiratory exchange ratio. (F) Physical activity. (G) Representative iWAT UCP-1 immunohistochemistry (IHC) from n = 6 Adipo–PGC-1α KO and 6 Adipo–PGC-1α KO + Adipo-TFEB female mice fed a Western diet. Scale bar, 100 μm. Data are presented as means ± SEM. Student’s two-tailed t test, *P < 0.05.

