
Figure 3.
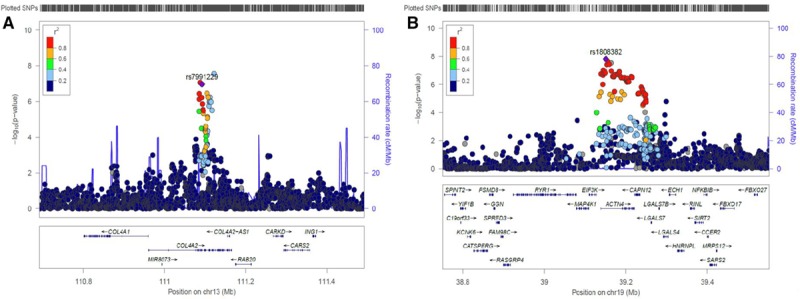
Regional association and recombination plots of variants that reached P value <5×10⁻⁷ in the meta-analysis of the 2 discovery study cohorts (GoDARTS and ORCADES). A, Lead SNP for TortA; B, lead SNP for TortV. Each plot was created using LocusZoom for the lead single-nucleotide polymorphism (SNP) in genomic region 400 kb in either side of the significant signal. Blue spikes represent the estimated recombination rates. Color scale (high to low r2) circles depicts the pairwise correlation (r2) between lead SNP and other SNPs in the loci. The lead SNP in that region is indicated by purple color solid diamond, and gene annotations in this region are shown in the bottom. GoDARTS indicates Genetics of Diabetes Audit and Research in Tayside; and ORCADES, Orkney Complex Disease Study.