Figure 1.

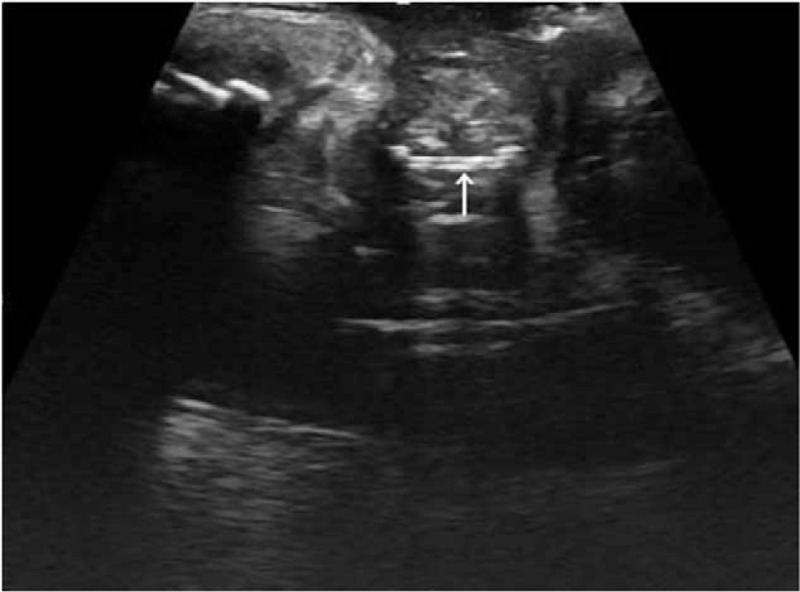
A transabdominal B ultrasound image showed a 59 × 55 × 23 mm fusiform region with increased signal intensity in the vagina followed by a sound shadow.

A transabdominal B ultrasound image showed a 59 × 55 × 23 mm fusiform region with increased signal intensity in the vagina followed by a sound shadow.