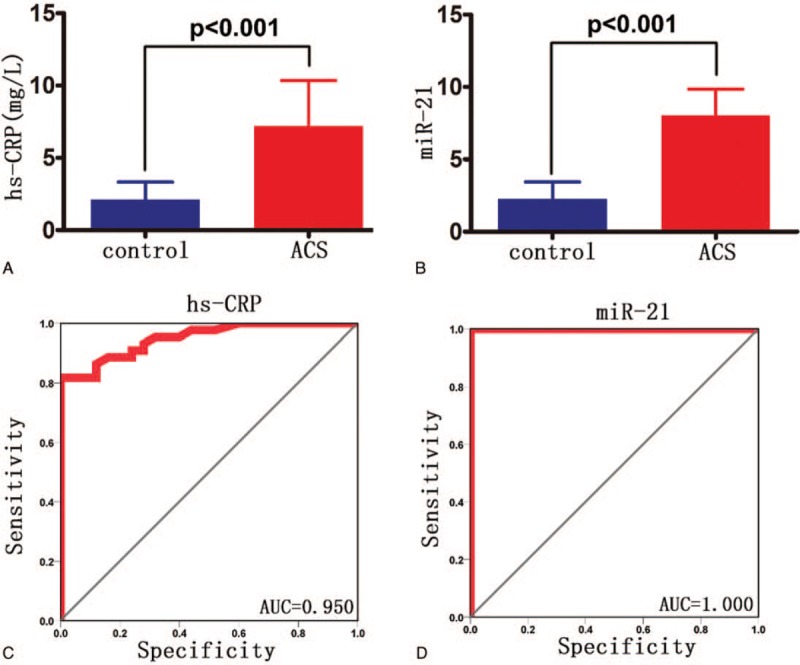
Figure 1.

The levels of miR-21 and hs-CRP in ACS group were significantly higher than those in healthy controls (P < .001, A and B). A. hs-CRP expression levels in both groups; B. expression levels of miR-21 in both groups; The levels of miR-21 and hs-CRP could distinguish healthy controls and ACS patients and the area under ROC curve (AUC) reached 0.950 and 1, respectively. C. hs-CRP ROC curve; D. miR-21 ROC curve. Control: healthy control group; ACS: ACS group.
