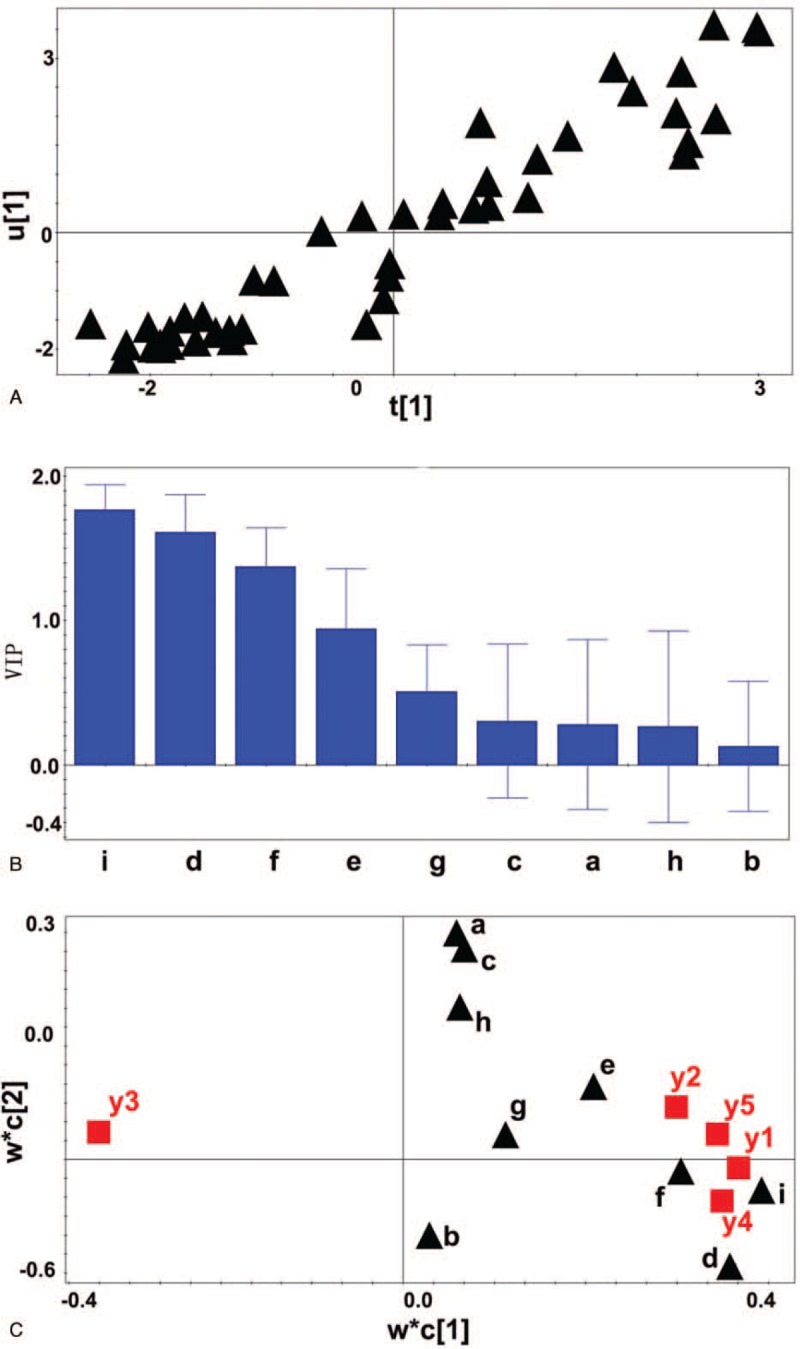
Figure 2.

A linear relationship between the number of vascular lesions, the number of vulnerable plaque, the thickness of the fibrous cap, the maximum area of the lipid core (%), the number of macrophages (Y variable) and the other explanatory variables (indexes as independent variables). A: t[1]∗u[1] scatter plot. B: VIP value of relevant observation indicators. C: w∗c1/w∗c2 scatter diagram. a: gender b: age c: weight d: hs-CRP e: hypertension f: diabetes g: hyperlipidemia h: smoking I: miR-21 expression level. Y1: the number of coronary lesions y2: vulnerable plaque number y3: fiber cap thickness y4: maximum lipid core area y5: the number of macrophages.
