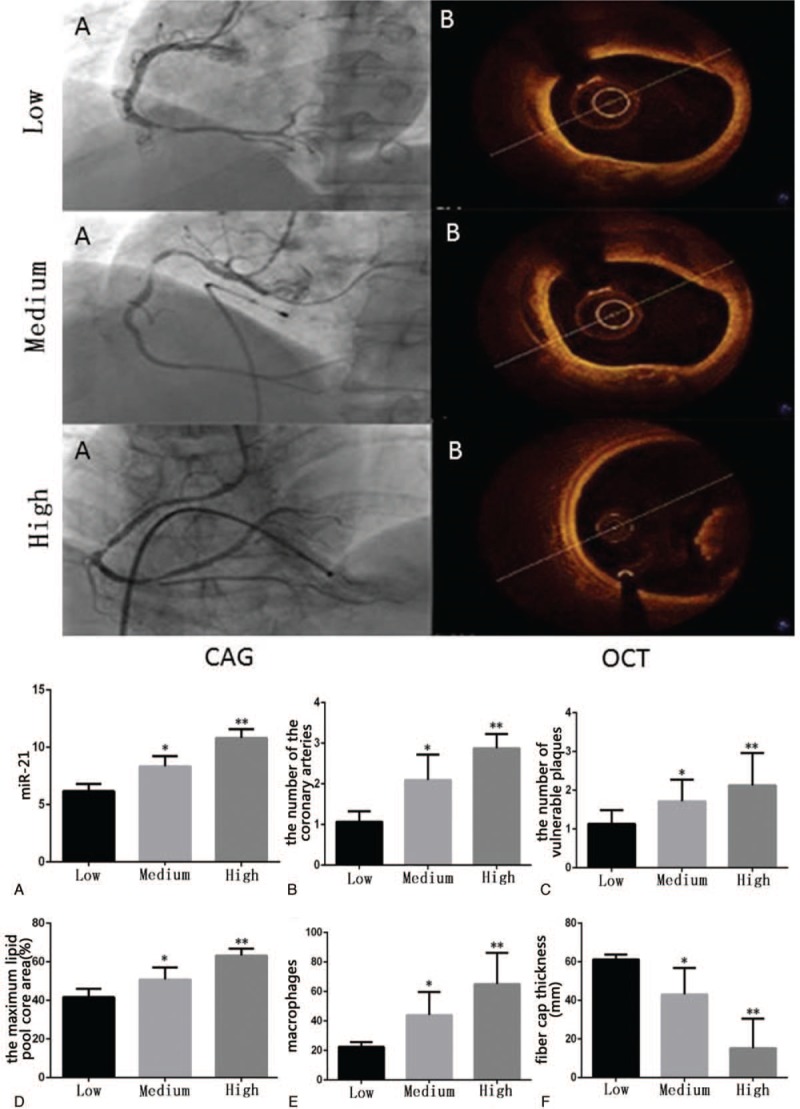
Figure 4.

MiR 21 expression level with coronary angiograph (Upper part A) and OCT examination (Upper part B). Bottom part: A: the expression of miR-21 was divided into groups. The number of coronary artery lesions (B), the number of vulnerable plaque (C), the core area of the lipid pool (D), and the number of macrophages (E) were significantly higher than those in low expression group. The thickness of fiber cap was significantly lower than that of low expression group (F). CAG: imaging of coronary angiography; OCT: OCT imaging. Low: Low expression group (miR-21 < 7); Medium: Medium expression group (7 < miR-21 < 10); High: High expression group (miR-21 > 10). CAG: coronary angiography; OCT: optical coherence tomography; Low: Low expression group; Medium: Medium expression group; High: High expression group. ∗ P < .01 vs Low. ∗∗ P < .01 vs Low.
