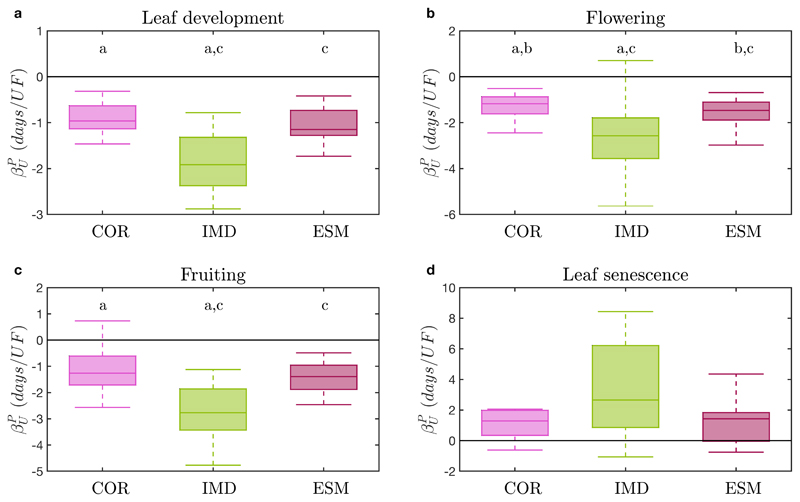
Figure 1. Coefficients of the MLR analysis describing unique changes in plant phenology with changes in urban fraction.
a-d, Significant MLR coefficients (; Eq. 1) for four aggregated phenological phases and three urban fraction (UF) metrics (COR … CORINE land cover, IMD … imperviousness degree, ESM … European settlement map). Significant (p < 0.05, Wilcoxon rank sum test) differences between urban fraction metrics are indicated by the same letters. Boxplots show the interquartile range (IQR, box), the median (horizontal line in box) and 1.5 x the IQR (whiskers), while outliers are omitted for clarity.

