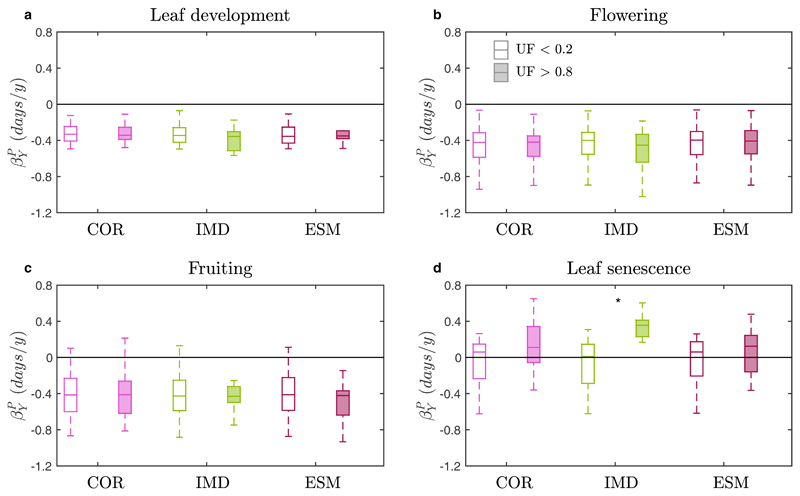
Figure 4. Coefficients of the MLR analysis describing unique changes in plant phenology over time.
a-d, Significant MLR coefficients (; Eq. 1) for four aggregated phenological phases and three urban fraction (UF) metrics (COR … CORINE land cover, IMD … imperviousness degree, ESM … European settlement map) with data stratified into low and high UF classes. Significant (p < 0.05, Wilcoxon rank sum test) differences between urban fraction metrics are indicated by the same letters, between low and high UF metrics by an asterisk. Boxplots show the interquartile range (IQR, box), the median (horizontal line in box) and 1.5 x the IQR (whiskers), while outliers are omitted for clarity.

