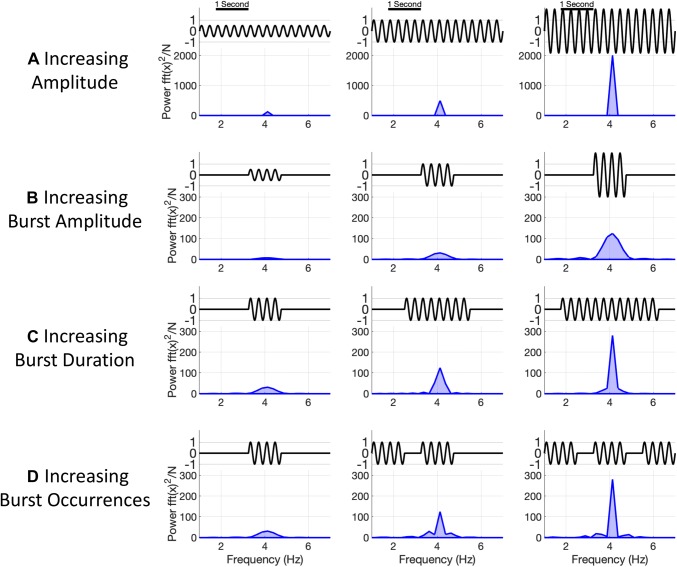
Fig. 1.
Illustration of how temporal dynamics can affect static power-estimates. a A tonic oscillation which increases in amplitude. In this instance, the peak in the power spectrum increases with each amplitude increase. Note that though the amplitude of the oscillations increases linearly, the peak in the power spectrum increases much faster. This is as power is related to the square of the amplitude of the oscillations. b A single burst which increases in amplitude. The increased amplitude leads to increases in the static power-spectrum even though only a single segment of the time-course is changing. c A single burst which increases in duration. The increased duration leads to large increases in the static power-spectrum which subjectively resemble the increases in a. However, in this case we might prefer to describe this change as increased duration rather than an increase in frequency domain power. d Finally, a burst of fixed duration which occurs more frequently. More occurrences have higher frequency domain power. As with b, we might prefer the temporal description that a burst occurs more frequently rather than overall power increases

