Fig. 7.
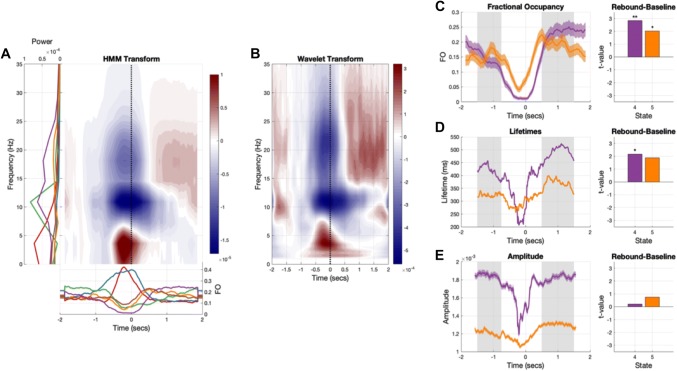
The task-related HMM dynamics. The HMM is able to reproduce the key features of a standard time–frequency decomposition and shows that the beta rebound effect is driven by increased occurrences of states 4 and 5, and increased lifetimes of state 4. a The HMM regularised time–frequency transform of the task data, computed from the outer product of the task-evoked fractional occupancies (bottom) and the state power spectra (left). b The baseline-corrected wavelet time–frequency transform of the task data. c Left—the fractional occupancy of states 4 and 5 across the trial. The shaded bars indicate the standard error of the mean across participants and the grey region indicates the baseline (− 1.5 to − .75 s) and beta rebound (.75 to 1.5) seconds. Right—t-statistics for a contrast between the baseline and rebound period for each state. Both states show a significant increase in occupancy during the rebound period relative to baseline (** indicates p < 0.01 and * indicates p < 0.05). d Left—the average lifetime of states 4 and 5 across the trial. The shaded bars indicate the standard error of the mean across participants and the grey region indicates the baseline (− 1.5 to − .75 s) and beta rebound (.75 to 1.5) seconds. Right—t-statistics for a contrast between the baseline and rebound period for each state. State 4 shows a significant increase in visit lifetime during the rebound compared to baseline. e Left—the average amplitude of states visits for states 4 and 5 across the trial. The shaded bars indicate the standard error of the mean across participants and the grey region indicates the baseline (− 1.5 to − .75 s) and beta rebound (.75 to 1.5) seconds. Right—t-statistics for a contrast between the baseline and rebound period for each state. Neither state shows a significant difference in visit amplitude compared to baseline

