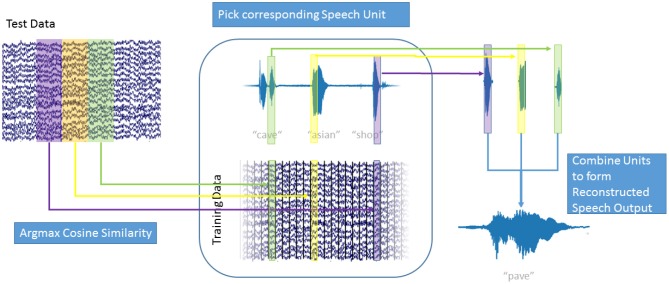
Figure 3.
Speech Generation Approach: For each window of high gamma activity in the test data (top left), the cosine similarity to each window in the training data (center bottom) was computed. The window in the training data that maximized the cosine similarity was determined and the corresponding speech unit (center top) was selected. The resulting overlapping speech units (top right) were combined using Hanning windows to form the generated speech output (bottom right). Also see Supplementary Video 1.

