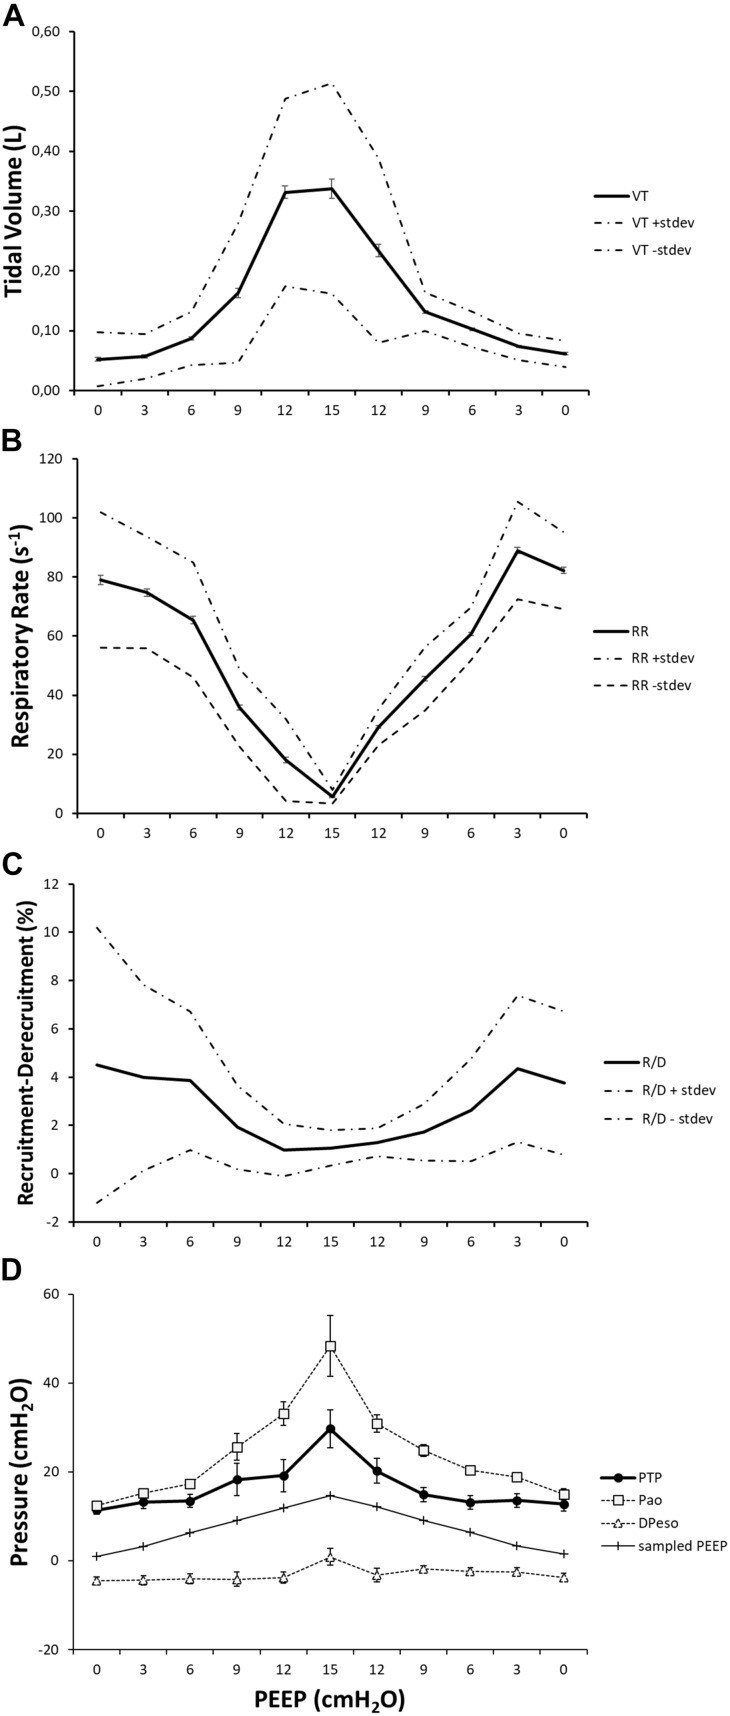
FIGURE 10.
The effect of positive end-expiratory pressure (PEEP) on respiratory variables, recruitment–derecruitment (R/D), and pressure conditions is presented in the graph. Panel (A) shows the increase in mean TV in effect of an increased PEEP level. Standard deviation is presented as dotted lines, and standard error is represented as bars. The respiratory rate is decreased in relation to increased PEEP level and subsequently increased when PEEP is decreased (B). Standard deviation is presented as dotted lines and standard error as bars. R/D is decreased as a response to increasing PEEP (C). Standard deviation is presented as dotted lines and standard error as bars. Graph (D) shows the recorded maximal transpulmonary pressure (PTP,MAX) during inspiration and, at the same time, values for airway pressure (Pao), sampled PEEP, and difference in esophageal pressure from end-expiratory esophageal pressure.

