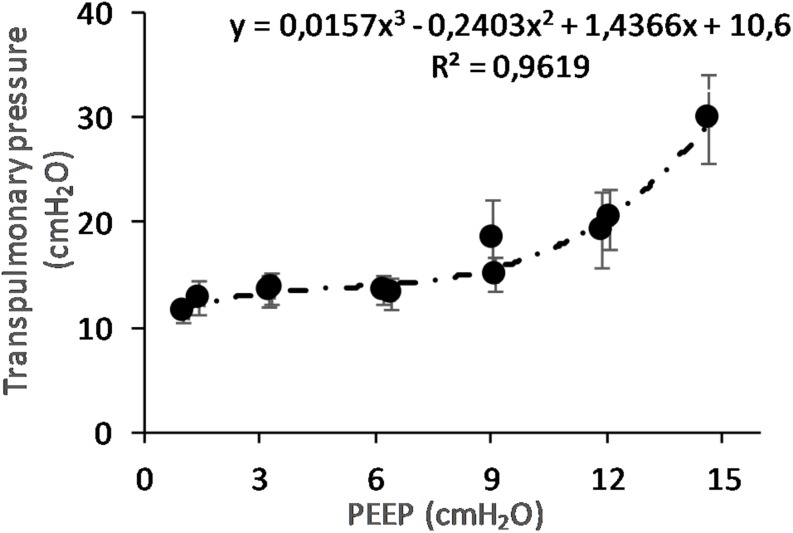
FIGURE 8.
Maximal transpulmonary pressure (PTP,MAX) in relation to positive end-expiratory pressure (PEEP) level. The graph shows the PTP,MAX and standard error observed during peak flow conditions. The PTP increases with increasing PEEP level. The changes are statistically significant as shown by regression analysis. When correcting for multivariable comparison, according to Pearson’s correlation, the changes still show significance (p < 0.01).

