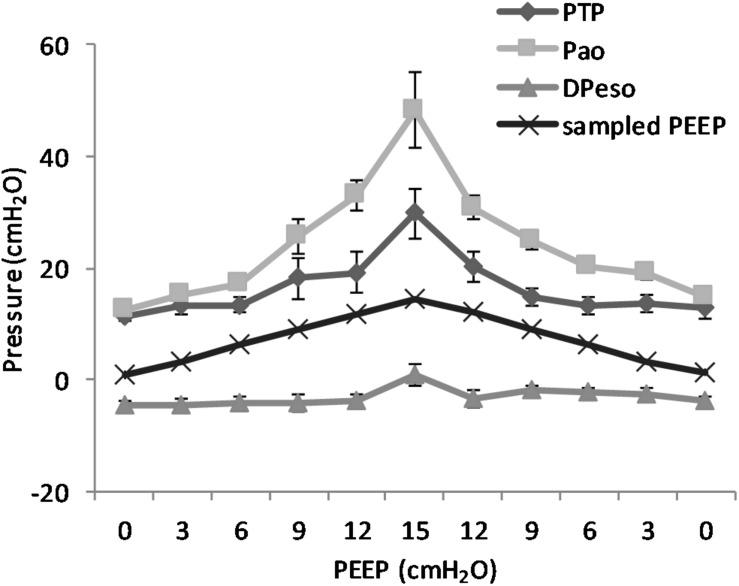
FIGURE 9.
Pressure levels in relation to positive end-expiratory pressure (PEEP) level. The figure shows the recorded maximal transpulmonary pressure (PTP,MAX) during inspiration and the values for airway pressure (Pao), the sampled PEEP, and the difference in esophageal pressure (DPESO) from end-expiratory esophageal pressure sampled at the same time point. It is worth to note that the PTP,MAX is not simultaneous with the maximal negative esophageal pressure, but it is reached later in the course of inspiration because of the interplay between pleural pressure and the rate of pressure increase in the airways. The non-linear increase in the difference between Pao and PTP is due to the increase in the resistive component of pressure due to the higher flow that is observed at higher PEEP. Standard error is presented as bars in the graph.

