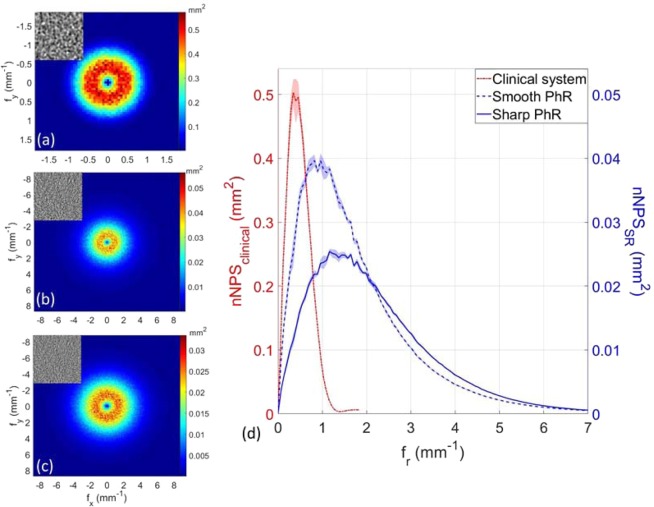
Figure 4.
Bi-dimensional normalized noise power spectra (nNPS) for (a) the clinical BCT system, synchrotron BCT with (b) smooth and (c) sharp phase-retrieval algorithm. Of note, the range of frequency axes in (a) is different from (b,c). The inset on the top-left corner of each image represent the same homogeneous ROI with an area of 20×20 mm2. (d) Radial averaged nNPS for the clinical system (dashed red line), and SR breast CT with smooth (dashed blue line) and sharp (solid blue line) phase-retrieval algorithm. Of note, the left y-axis refers to the nNPS of the clinical system, while the right y-axis to the synchrotron breast CT. The shaded region around each line represents one standard deviation uncertainty.

