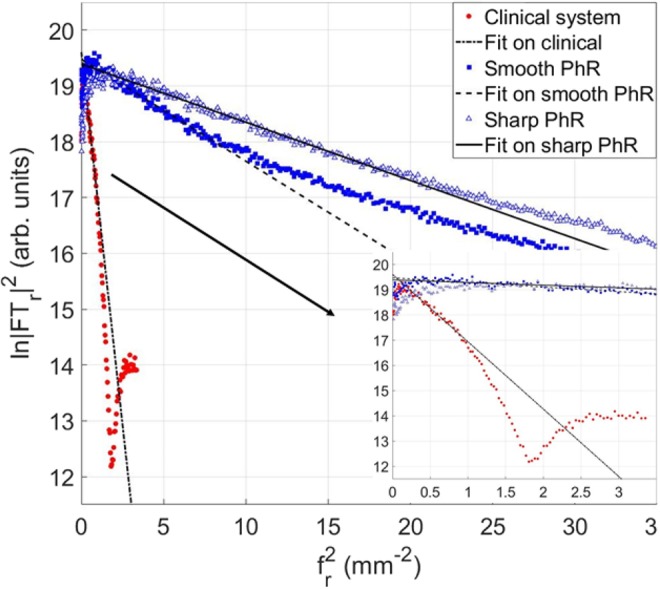
Figure 5.

Evaluation of the spatial resolution for the clinical system (red circles), and synchrotron breast CT with smooth (blue squares) and sharp (blue-white triangles) phase-retrieval algorithm. The logarithm of the squared absolute value of the image Fourier transform (on y-axis) is plotted as function of the square of the spatial frequency (on x-axis). The linear fit for each dataset is shown with black lines. The inset displays a zoom at lower spatial frequencies.
