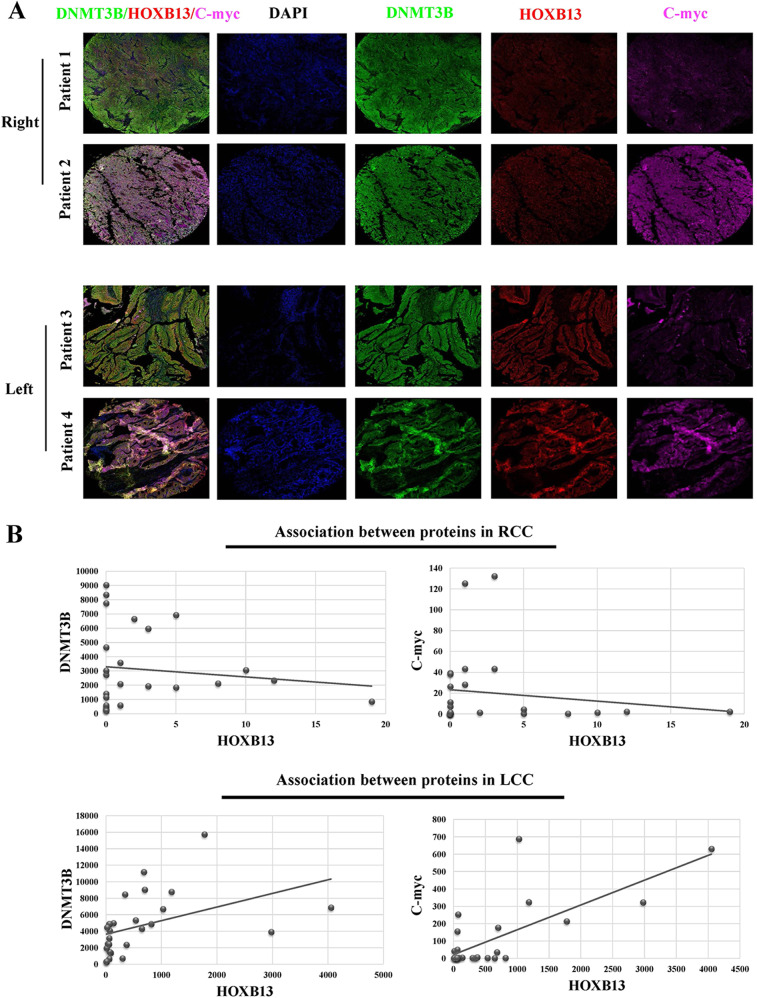
Fig. 7.
HOXB13 expression is negatively correlated with DNMT3B and C-myc expression in RCC. a Representative fluorescence images showing DNMT3B, HOXB13 and C-myc staining in CRC tissues; each tumor slide was stained for DNMT3B, HOXB13 and C-myc, which are indicated by the green, red and pink fluorescence channels, respectively. DAPI was used to visualize nuclei. b Quantification of DNMT3B +, HOXB13 + and C-myc + cells in CRC samples. Linear regression was performed to analyze correlations between the levels of different proteins in RCC and LCC

