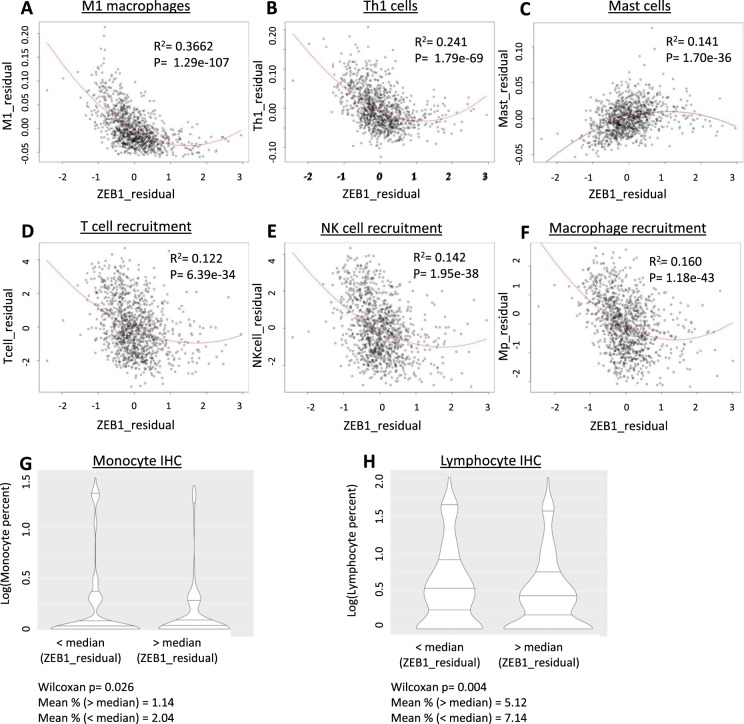
Figure 3.
Stroma-corrected ZEB1 expression is inversely correlated with the abundance of multiple immune cell types and with immune cell recruitment to breast tumors. (A–C) Residual plot of ZEB1 expression and xCELL macrophage (A), Th1 cell (B) and mast cell (C) abundance corrected for stromal cell content. (D–F) Residual plot of ZEB1 expression and TIP-based estimation of T cell (D), natural killer cell (E) and macrophage (F) recruitment. (G) Immunohistochemistry measurement of monocyte percentage in tumor samples compared by samples with greater or less than median stroma-adjusted ZEB1 expression (median percentage 0%). (H) Immunohistochemistry measurement of lympocyte percentage in tumor samples compared by samples with greater or less than median stroma-adjusted ZEB1 expression (median percentage 1%).

