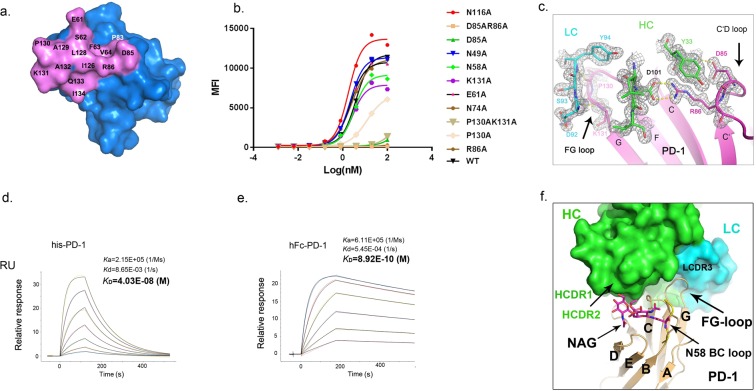
Figure 2.
The binding interaction between mAb059c and PD-1. (a) The binding footprint on PD-1 recognized by mAb059c. The PD-1 surface is shown in blue, and the mAb059c epitope region is shown in violet. Individual residues contributing to the binding are labeled. The footprint is selected by a distance of 5 Å around mAb059c; (b) The electron density map 2Fo-Fc is generated by the FFT program in CCP4 and displayed by Pymol. Residues from the FG loop (130–131) and C’D loop (85–86) of PD-1, HCDR3 (100–102), LCDR1 (92–94) and Y33 of mAb059c are shown with stick representation surrounded by an electron density map; (c,d) KD measurement of deglycosylated his-PD-1 (c) or glycosylated hPD-1 (d) by BIAcore 8 K; (e) The fitting curves of different mutants on critical residues. Y axis – mean fluorescence intensity. X axis – Log(nM). (f) Superimposition of PD-1 of 5WT9 and the PD-1 of 6K0Y. For simplicity, the structure of 5WT9 is not shown except for the BC loop fragment (residues 56–59, yellow) of 5WT9 (in cartoon representation). The N-glycan at N58 GlcNac(FUC)-GlcNac is shown with magenta stick representation.

