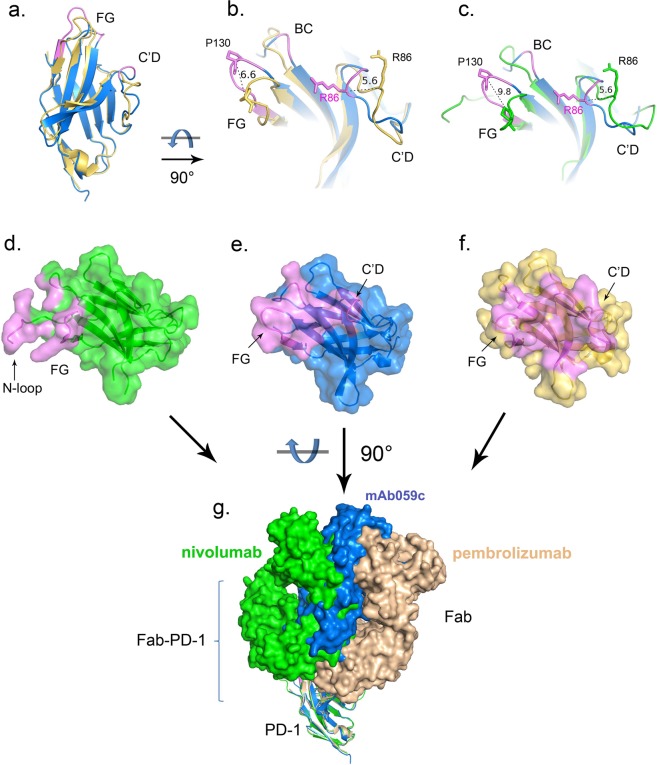
Figure 5.
Epitope comparison PD-1 structures of mAb059c-PD-1, pembrolizumab-PD-1 and nivolumab-PD-1 are superimposed in Pymol. Epitopes are shown in purple color. (a) PD-1 of mAb059c-PD-1 (blue) and pembrolizumab-PD-1 (wheat) are superimposed in cartoon representation; (b). Zoom-in view of fig. a; (c). Zoom-in view of the PD-1 structures of mAb059c-PD-1 (blue) and nivolumab-PD-1 (green); distances between R86 (C’D loop) residues and distances between P130 (FG loop) residues from individual structures are indicated with black dashed lines; (d). Surface of PD-1 from nivolumab is shown in green; e. Surface of PD-1 from mAb059c is shown in blue; (f). Surface of PD-1 from mAb059c is shown in wheat; g. Relative postures of the Fabs (with surface representation) are shown in this figure. From left to right in sequence - Green: nivolumab, Blue: mAb059c, Wheat: pembrolizumab. PD-1s superimposed are shown with cartoon representation.

