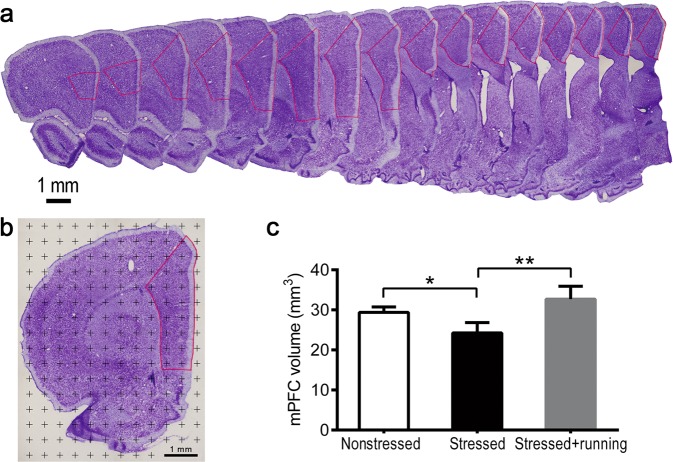
Fig. 1. Illustrations of the methods to quantify the mPFC volume and the effects of running exercise on the total volume of the mPFC of CUS rats.
a An illustration of the mPFC boundary after cresyl violet staining. The area within the red lines was the mPFC. Scale bar = 1 mm. b An illustration of the method used to estimate the total volume of the mPFC. The points located inside the red line were counted. Scale bar = 1 mm. c Total volume of the mPFC in the nonstressed group, stressed group and stressed + running group (mean ± SD, n = 5 per group). *p < 0.05, **p < 0.01. mPFC medial prefrontal cortex.

