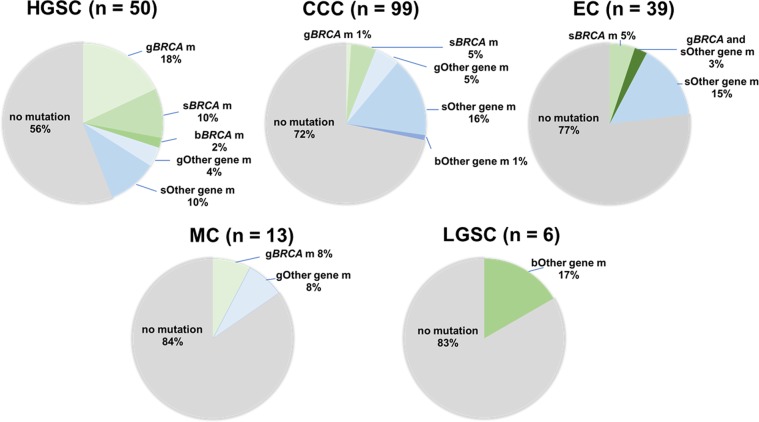
Figure 1.
Frequency of HR-associated gene mutation based on histology. The frequency of HR-associated gene mutation based on histology is shown in each pie chart. The mutation data were classified into seven categories – germline BRCA mutation (gBRCA m), somatic BRCA mutation (sBRCA m), both germline and somatic BRCA mutation (bBRCA m), other germline gene mutation (gOther m), other somatic gene mutation (sOther m), other germline and somatic gene mutation (bOther m), and no mutation.

