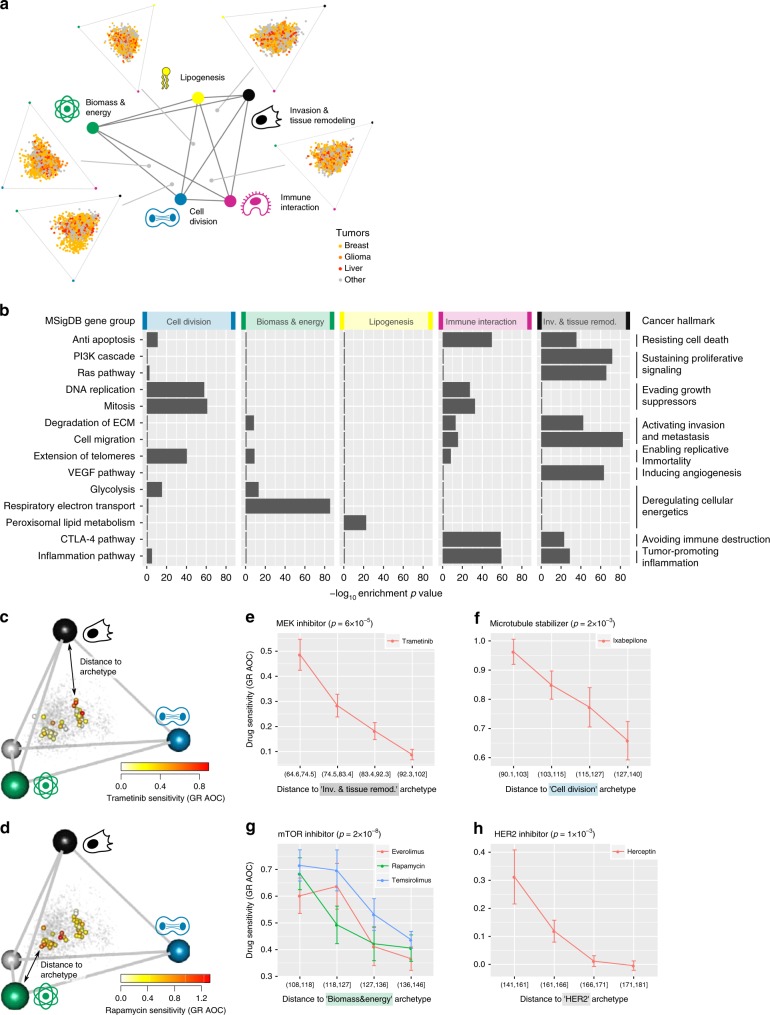
Fig. 2.
Tumors face trade-offs between five universal cancer tasks. a Gene expression profiles of tumors from six cancer types fall in a continuum bounded by five archetypes, with indicated tasks. Tumors are shown projected on polyhedron faces (light orange—breast, dark orange-glioma, red—liver, gray—other tissue). Archetype number and position (colored dots) were inferred using ParTI. b The five cancer tasks represent hallmarks of cancer19. For each cancer hallmark, one to three representative MSigDB gene groups were chosen. P-value are for enrichment in the 5% of the tumors closest to each cancer archetype (Mann–Whitney test, n = 159 tumors). For visualization, gene groups that are not significant at FDR < 0.1 or are not maximally enriched at a given archetype are set to 1. c–d Breast cancer (BC) cell-line gene expression14, projected on the BC tumor tetrahedron. Color: sensitivity of cell lines to indicated drug. Grey dots: breast tumors. e–h Sensitivity to indicated drug, defined as area under curve (AOC) of growth rate (GR) dose response, as function of Euclidean distance of cell-line gene expression to indicated archetype14,38. Error bars represent SE. P-values from the Mann–Whitney test (n = 14 cell lines).

