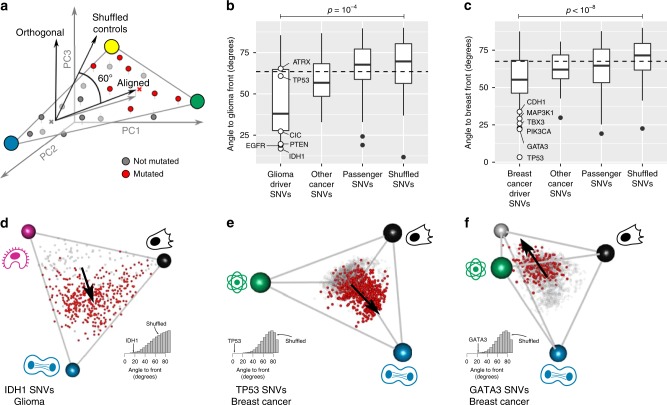
Fig. 3.
Driver mutations push tumor expression towards specialization in specific tasks. a The effect of a mutation on gene expression is defined as the vector (grey arrow) connecting the centroids of tumors without (gray) and with (red) the mutation (schematic). Alignment of mutation effect vector to the front is defined by the angle of the effect vector to the subspace defined by the front. Shuffled controls show a 62–75° angle with the front depending on cancer type. b–c In glioma (b) and breast cancer (c), driver mutations are better aligned to the polyhedron formed by the archetypes than passenger mutations and random mutations. White dots: six most frequent driver SNVs in that cancer type. Center line, median; box limits, upper and lower quartiles; whiskers, 1.5× interquartile range; black dots, outliers. P-values from the Mann–Whitney test (n = 18 driver mutations for glioma, n = 53 for breast). d In low-grade glioma, IDH1 SNVs point approximately towards the cell division archetype. e In breast cancer, TP53 SNVs point towards the cell division archetype. f In breast cancer, GATA3 SNVs point towards the face defined by the lipogenesis, invasion and tissue remodeling and HER2 archetype.

