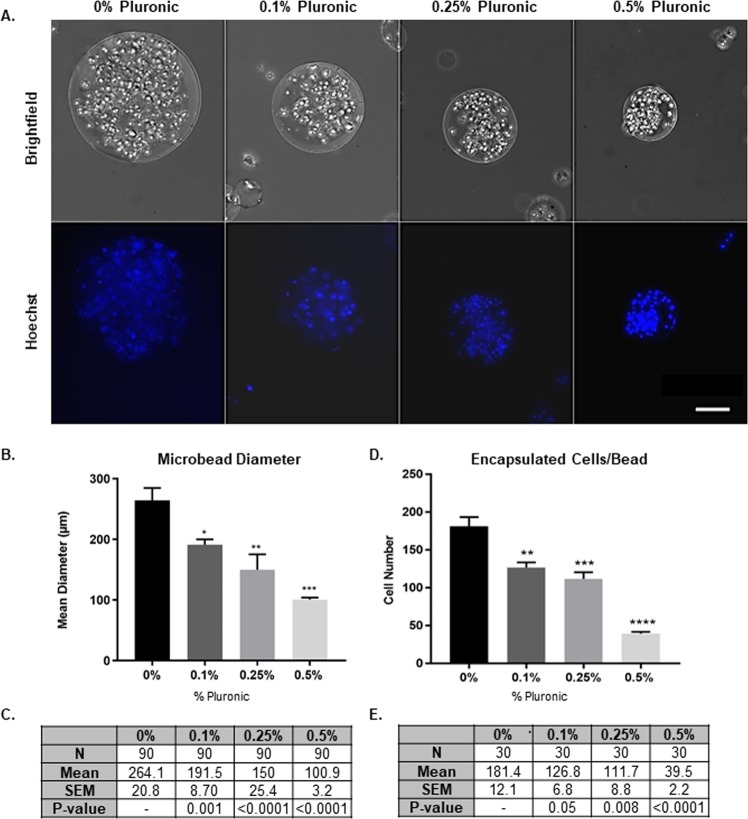
Figure 1.
Creation and Optimization of Cell-Encapsulated Microbeads. (A) Brightfield images of NSC encapsulated in microbeads (top row) and nuclei stained with Hoechst (bottom row), demonstrating influence of Pluronic concentrations from 0 to 0.5% additions. (B) Microbead mean diameter for varying Pluronic concentration (n = 3). Values tabled in (C). (D) Cells encapsulated per bead for varying Pluronic concentrations (n = 3). Values tabled in E. Error bars represent SEM. Scale bar (50 µm) representative of all images. *p ≤ 0.05, **p ≤ 0.01, p ≤ 0.001, and ****p ≤ 0.0001 compared to 0% Pluronic determined by 1way ANOVA with multiple comparisons.

