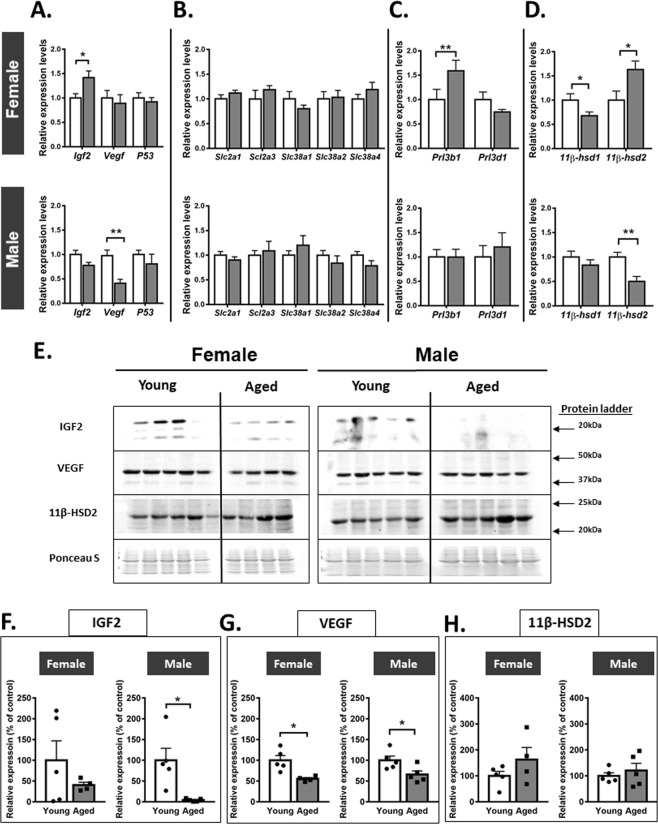
Figure 3.
Placental gene and protein expression in young versus aged dams. Expression of growth regulatory (A), nutrient transporter (B), placental lactogen (C) and glucocorticoid metabolism (D) genes in placentas from female and male fetuses. Western blot images of IGF2, VEGF and 11-βHSD2 (E) abundance in female and male placentas with quantification of proteins adjusted for Ponceau S staining (F–H, respectively). For gene expression analyses, data are from 10–12 placentas from 5 litters per group and for protein abundance, data are from 4–5 placentas each from different litter. All data are presented as mean + SEM values. Significant difference between young and aged dams were determined by unpaired student t test, *p < 0.05.

