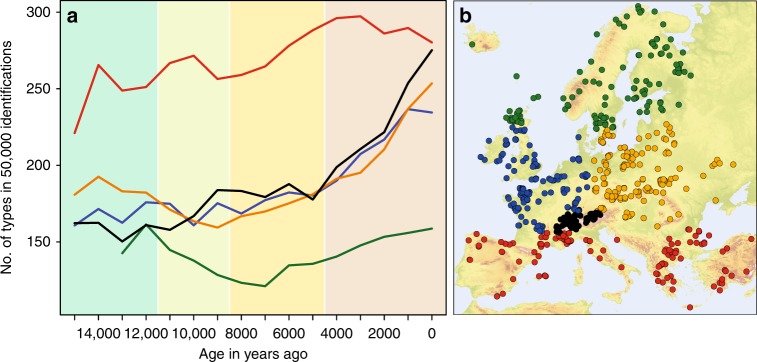
Fig. 1.
Regional pollen type richness through time based on 749 pollen diagrams from Europe and Turkey. a Pollen type richness in regionally pooled samples with up to 107 identifications per sample. Comparisons are made at a sample size of 50,000 identifications using rarefaction based on all accepted types. Standard deviations are not shown due to their small values between 3 and 9. Line colours indicate regions: green = Boreal, blue = Temperate Oceanic, orange = Temperate Continental, red = Meridional/Submeridional, black = Alps. Time-periods (rounded to the nearest 0.5 ka) indicated by background colours: Lateglacial—11.5 ka—Early Holocene—8.5 ka—Middle Holocene—4.5 ka—Late Holocene. b Locations of pollen diagrams used in the analysis. The colouring of the locations corresponds to the line colours of the regions in (a). Digital elevation data for Fig. 1b was obtained from the European Environment Agency (EEA).

