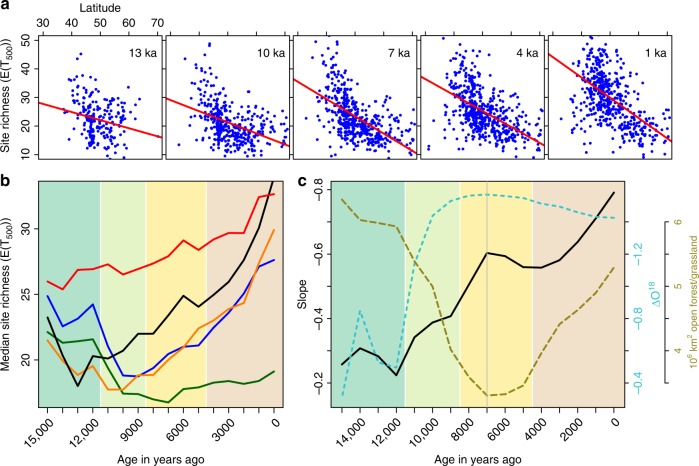
Fig. 2.
Site-based changes in pollen type richness at a standardized sample size of 500 identifications. a Scatter plots of pollen type richness versus latitude for selected time slices. b Median richness over all sites per region, colour coding as in Fig. 1. c Slope of the regression between pollen type richness and latitude of the site = black line; NGRIP Oxygen isotope record28 resampled to the same resolution = light-blue broken line; area of partially open forests and grasslands in Europe taken from ref. 10 as a measure of landscape openness = brown broken line.

