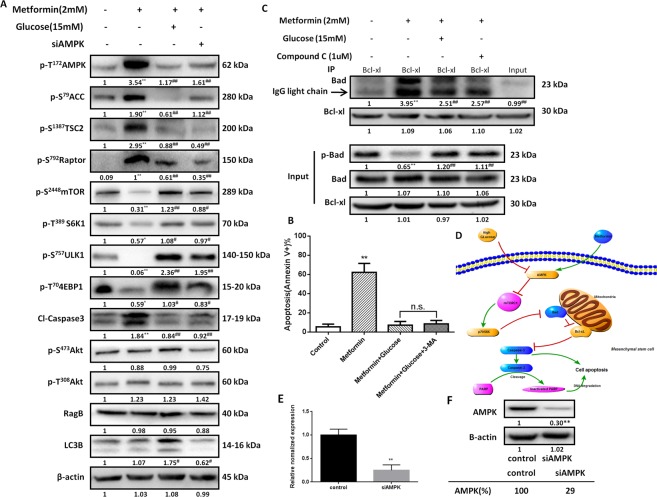
Figure 2.
Glucose modulates MSC resistance to metformin-induced apoptosis in an AMPK-mTOR-S6K1-Bad-dependent manner. (A) The expression of cleaved caspase-3, AMPK and its downstream markers, and mTOR and its downstream markers in hUC-MSCs treated with metformin (2 mM) with or without glucose (15 mM) or siAMPK as determined by western blotting. β-actin was used as a loading control. The numbers under each blot represent the relative quantification of the band density, which was calculated as the ratio of the band density each group to the band density of the control group or the metformin group. The average grayscale intensities of the control bands are denoted as “1”, and the data are presented as the means. *p < 0.05, **p < 0.01, versus the control group, by one-way ANOVA. #p < 0.05, ##p < 0.01, versus the metformin group, by one-way ANOVA. (B) After the treatment with metformin (2 mM), glucose (15 mM) and 3-MA (5 mM), the apoptosis (Annexin V+) rates were analyzed by flow cytometry, n = 5 per group. **p < 0.01, versus the control group, by one-way ANOVA. n.s. = no significance by one-way ANOVA. (C) hUC-MSCs were treated with metformin (2 mM) with or without glucose (15 mM) or siAMPK. After the treatment, the cell lysates were immunoprecipitated with an anti-Bcl-xL antibody and immunoblotted with an anti-Bad antibody. The presence of Bad and Bcl-xL in the lysates was examined. *p < 0.05, **p < 0.01, versus the control group, by one-way ANOVA. #p < 0.05, ##p < 0.01, versus the metformin group, by one-way ANOVA. (D) The signaling pathway through which glucose modulates metformin-induced MSC apoptosis. Expression of AMPK in hUC-MSCs 24 h after the transient transfection of siAMPK at the E transcriptional (qRT-PCR) and F translational (western blot) levels. **p < 0.05 by t-test.

