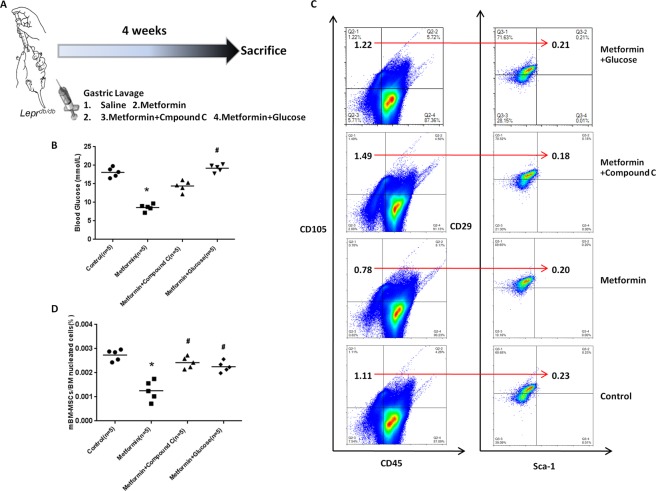
Figure 3.
Glucose modulates MSC resistance to metformin-induced apoptosis in vivo. (A) Diabetic mice were treated with saline, metformin (250 mg/kg/d, i.g., n = 5), metformin and compound C (AMPK-inhibitor) (0.1 mg/kg/d, i.g., n = 5), or metformin and glucose (1000 mg/kg/d, i.g., n = 5) by oral gavage for 4 weeks; then, all mice were sacrificed to isolate the mouse bone marrow derived mesenchymal stem cells (mBMSCs) for a flow cytometry assay. (B) Blood glucose levels in different groups before sacrifice. *p < 0.05 vs. the control group; #p < 0.05 vs. the metformin group by a one-way ANOVA. (C,D) Metformin treatment induced a significant decrease in mBMSCs compared with that in the saline group. Compared with the metformin group, glucose and compound C reduced the metformin-induced mBMSC decrease (CD45-CD105+ CD90+ Sca-1+). The direction of the arrow in the figure represents the proportion of the right cell group (CD29 + Sca-1+) in the cell group (CD45-CD105+) shown on the left. Lines in D represent the mean (n = 5 per group). *p < 0.05 vs. the control group; #p < 0.05 vs. the metformin group by a one-way ANOVA. mBMSCs, mouse bone marrow mesenchymal stem cells.

