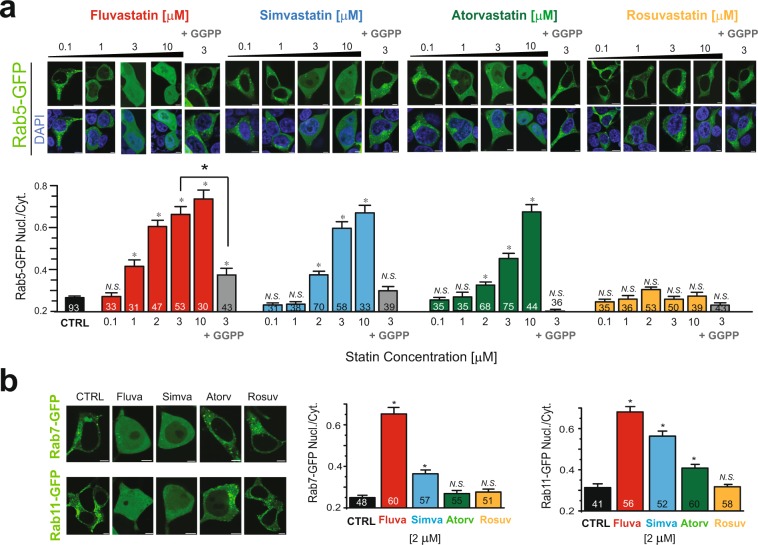
Figure 1.
Statins specificity of Rab-GTPase inhibition. (a) Top, Typical confocal microscopy images of HEK293T cells over-expressing Rab5-GFP after overnight statin treatment at the indicated concentration in the presence or absence of 10 µM GGPP. Bottom, Summary of Rab5 nucleus/cytoplasm fluorescence ratio of the experiment performed in top panel. (b) Left, typical confocal images of HEK293T cells over-expressing either Rab7-GFP or Rab11-GFP in control conditions, or after 2 μM statin treatment for overnight. Right, Summary of Rab7 and Rab11 nucleus/cytoplasm ratio. Scale bars, 5 μm. *p < 0.05 (number of cells analyzed).

