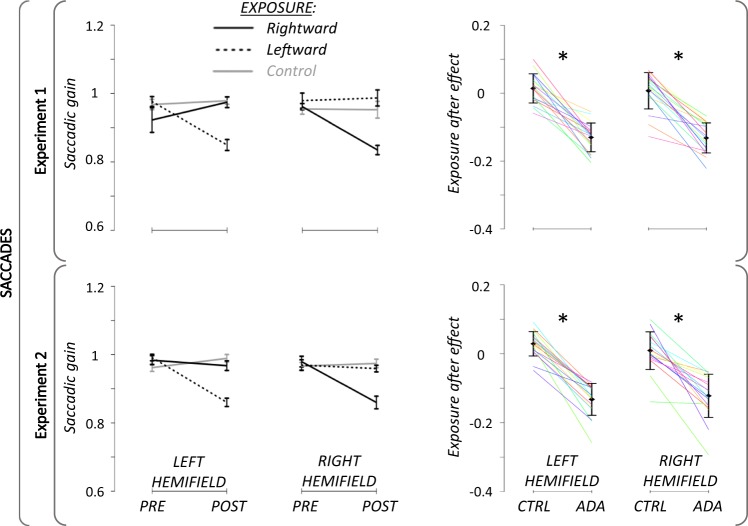
Figure 4.
Pre- and Post-exposure saccadic task results. Left panels: Group mean (+/−SD) of saccadic gain for Experiment 1 (upper panel) and Experiment 2 (lower panel). Black lines: rightward adaptation exposure; Black dotted: leftward adaptation exposure; Grey lines: control exposure. Right panels: Individual percent gain changes between the pre- and the post-exposure tasks (after-effect) for Experiment 1 (upper panel) and for Experiment 2 (lower panel). Only data from the adapted hemifield are shown for adaptation exposures (ADA), i.e. left or right hemifield for adaptation exposure of leftward and rightward saccades, respectively; and values of the control exposure (CTRL) are plotted for each corresponding hemifield. Solid black lines represent group mean (+/− SD) and colored lines stand for individual values. *: p-value < 0.05.

