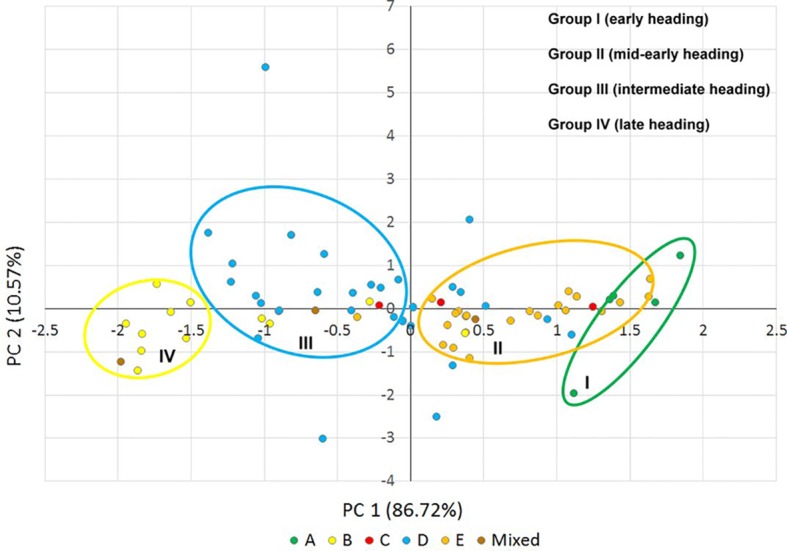
Figure 7.

Scatter plot of principal components 1 and 2, explaining 97.29% of the phenotypic variance in the heading time (2016, 2017, and 2018) of the Ae. biuncialis collection. Different colored dots indicate the Ae. biuncialis accessions in the subpopulations (A–E) obtained from STRUCTURE analysis. Groups I–IV indicate the phenotypic categories for heading time.
