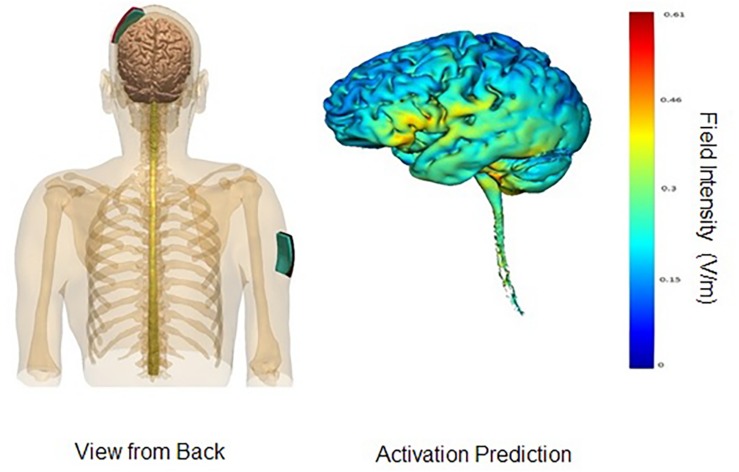
FIGURE 2.
DLPFC montage. Images display the DLPFC tDCS montage with anode on left DLPFC area and cathode on right deltoid muscle. Activation prediction based on modeling software from Soterix HD-Explore; color gradients reflect increasing levels of predicted intensity from blue to red, where red reflects a peak intensity of 0.61 mA. Images courtesy of Soterix.

