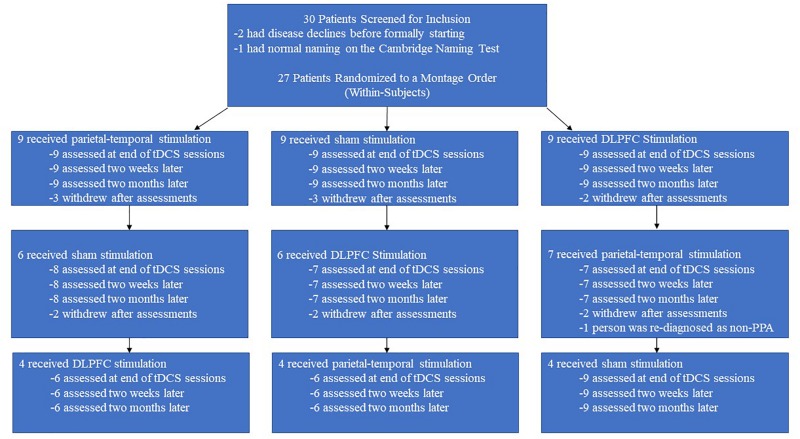
FIGURE 3.
Attrition rate over time. The above flowchart displays the attrition rate for the separate counter-balance groups across the different rounds. Each counter-balance group began with an initial cohort of nine participants, but attrition led to only 4 people completing the three rounds without disease progression effects.

