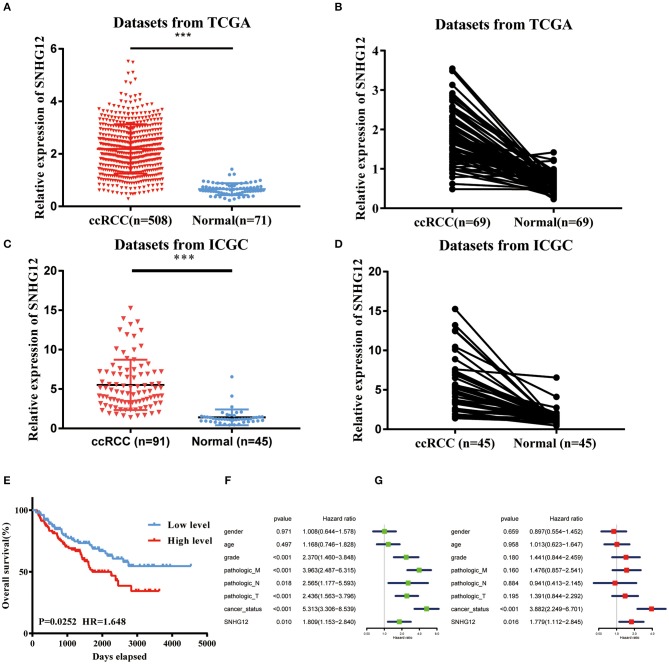
Figure 1.
SNHG12 was upregulated in ccRCC tissues. (A) Relative expression of SNHG12 in ccRCC tissues compared with normal tissues was analyzed using TCGA data. (B) Relative expression of SNHG12 in 69 pairs matched ccRCC tissues and normal tissues in TCGA data. (C) Relative expression of SNHG12 in ccRCC tissues compared with normal tissues was analyzed using IGCA data. (D) Relative expression of SNHG12 in 45 pairs matched ccRCC tissues and normal tissues in TCGA data. (E) Kaplan-Meier survival curves according to SNHG12 expression levels in TCGA data.Univariate (F) and multivariate (G) Cox regression analysis of clinical parameters and SNHG12 in TCGA database of ccRCC patients. Clinical variables included gender (Female vs. Male), age (<60 vs. > = 60), grade (G1+G2 vs. G3+G4), pathologic_M (M0 vs. M1), pathologic_N (N0 vs. N1), pathologic_T (T1+T2 vs. T3+T4), cancer_status (Tumor free vs. With tumor) and SNHG12 (Low level vs. High level). Error bars stand for the mean ± SD of at least triplicate experiments. ***P < 0.001.

